Global and China IC Advanced Packaging Industry Report, 2013-2014
-
Aug.2014
- Hard Copy
- USD
$2,800
-
- Pages:150
- Single User License
(PDF Unprintable)
- USD
$2,600
-
- Code:
ZYW180
- Enterprise-wide License
(PDF Printable & Editable)
- USD
$4,100
-
- Hard Copy + Single User License
- USD
$3,000
-
Global and China IC Advanced Packaging Industry Report, 2013-2014 is mainly all about the followings
1. Overview of semiconductor industry
2. Status quo of memory and wafer foundry industry
3. Upstream market of semiconductor industry
4. Trend in emerging advanced packaging technologies
5. Analysis and ranking of packaging enterprises
6. 23 major advanced packaging vendors
Typically, an independent packaging and testing vendor is known as OSAT. In 1997, the OSAT industry scale was no more than USD5.1 billion or so, making up 19.6% of the semiconductor industry, in sharp contrast to the market size of USD23.6 billion in 2011, a figure that occupied 30% of the semiconductor industry. During 2011-2013, the packaging and testing industry saw an AAGR of less than 5% for 3 consecutive years, which mainly resulted from the fact the advanced packaging technologies developed from 2005-2010 period began to be popularized, thus leading to a dramatic decline in unit prices, these packaging technologies including FC-BGA, WLCSP, QFN, SiP, and PoP, etc.
At present, both mobile phones and computers are developing towards ultra-thin, multi-core and high frequency while memory industry is targeted at ultra bandwidth, which would prompt the packaging and testing market to satisfy the market demand with the updated technologies. Since 2014, a number of new technologies have been applied, which would bring with it a more than 6% growth in packaging and testing industry. These technologies, including MLP PoP, Cu Bol, FC-CSP, FOWLP, Embedded Component (Trace) Substrate, and 2.5D, are mainly used in smartphones and ultra-thin computers, with a robust market demand. Meanwhile, TSV is expected to be widely applied from the memory industry. On the other hand, some major IDM vendors like Panasonic and Renesas Electronics have retreated from packaging business. It is projected that in 2014 the output value of OSAT industry will grow by 8.4% to USD27.2 billion, and advanced packaging industry probably by 10% to USD18.2 billion.
In terms of industry, a type of middle-end enterprises has emerged between Foundry or IDM and OSAT since 2008. In the era of FC packaging, these enterprises mainly provide RDL, Wafer Bumping, and Wafer Level Test. But in the age of 2.5D and 3D, their scope of business has been greatly expanded, primarily including Micro Bumping, Thin & Reveal, Interposer, Via Middle, WL-Carrier Assembly, etc.
In 2014, the biggest event that happened to the packaging industry was nothing but the attempt of Temasek to sell STATS ChipPAC, the world's fifth largest packaging company. Owned by the Government of Singapore, STATS ChipPAC is less competitive, especially when facing the competition from the Taiwanese rivals. Although it has state-of-the-art technologies, yet the company depends heavily on its key accounts, including Infineon, Apple Inc., Qualcomm, and Broadcom, etc. However, Infineon has gradually withdrawn from mobile phone market while Apple Inc. and Qualcomm have diversified supply chain risks, cutting down on the orders of STATS ChipPAC, which led to a fall in revenue for four consecutive years.
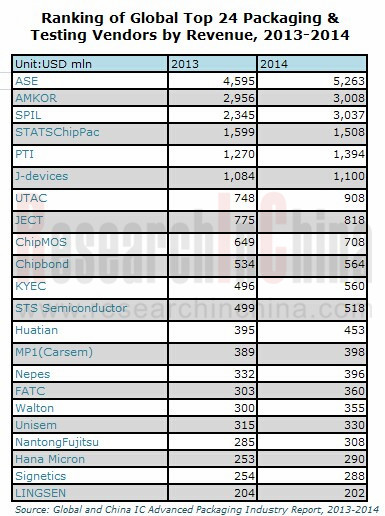
In addition, a second major event was the fact that SPIL had won massive orders from Qualcomm, MTK as well as Huawei’s Hisilicon, which would considerably increase SPIL’s revenue. In H1 2014, SPIL harvested a substantial growth of 27% in revenue, making it the world’s No.1 by operating margin. In 2014, the company is expected to surpass Amkor as the global second.
In terms of technology, 3D (TSV) application is not yet so mature that the market is still confined to such non-mainstream fields as CIS, MEMS, and HB LED. The key Logic+Memory market have not made progress and will not get improvements in the coming 5 years, with PoP packaging still the mainstream. This comes mainly from the following reasons:
1. Costs. PoP packaging is stable and mature, with lower costs. Also, it demonstrates great potential of performance;
2. KGD. Before the PoP packaging, its internal components have been tested individually and burn-in while TSV requires packaging before test and burn-in. Once some problems occur to an individual component, then the entire TSV has to be discarded;
3. TSV cannot rework but PoP could;
4. TSV need to thin wafer for several times as wafer is easy to bend or break, with a low yield;
5. The electronic system that supports PoP packaging is widely applicable, the current SMT production line is feasible, but TSV needs change;
6. PoP packaging has a very high yield;
7. PoP packaging has a good business model and failure analysis methods are mature. By contrast, TSV’s failure analysis methods are not mature, which made it difficult to define the responsibility of the bad products.
8. PoP packaging is the Logic + Memory, and Memory is one of the ICs with the highest prices among the mobile phone semiconductors, with its prices showing sharp and frequent fluctuation. Moreover, it has higher market concentration. To ensure a good management of supply chain, the vendors must promptly adjust the purchase quantity or purchase price of Memory. However, as for TSV, the prices and purchase quantity cannot be changed, which, to rapidly changing electronics industry, means the huge losses or a failure of timely shipment.
Another problem of 3D packaging is heterogeneity heat treatment. Logic Die such as CPU or GPU may generate a large amount of calories while Memory, which is coordinated with Logic Die, generates a small amount of heat. If CPU is integrated with DRAM and NAND Flash, its high heat will affect DRAM and NAND Flash. And if we use 3D packaging, heat dissipation cannot be solved. The best solution is to adopt 2.5D packaging.
Of course, 3D packaging is still promising, and a breakthrough has been made in the Memory. Since the current Stacked Wire Bonding SiP has no longer satisfied the demand, the vendors, hoping to further raise the Bandwidth to 15Gbps or above, must adopt TSV. Micron calls it as HMC, and SK Hynix known as WIDE 1/O2. It is expected that by the end of 2014 TSV packaging will achieve mass production.
Currently, what has become the top concern in the market is the packaging of mobile phone CPU, Application Processor and Baseband. And the mainstream CPU packaging formats now include PoP, which would develop towards reducing the size, raising Fine Pitch and embedding Passive/Active Component. The technologies for reducing the size like MLP are represented by APQ8064 of Qualcomm; those for raising Fine Pitch by Kirin 920 of Hisilicon. And Embedded Passive/Active Component is typically represented by A7 of Apple. The mainstream baseband packaging is now FC-BGA and the future development trend may be FC-CSP, whose typical example is MT6589 of MTK.
Packaging industry is dependent heavily on the upstream Foundry and IDM vendors. This is particularly true of Foundry, which would have great impact on the performance of packaging vendors. Packaging technologies in Mainland China have long been backward, which was mainly due to a lack of advanced Foundry except indeed their own reasons. The packaging industry in Taiwan leads the world, which is mainly because Taiwan has the world’s most advanced Foundry, with 80% of high-end IC globally from the region. Therefore, no matter how strong the mainland companies are, they cannot bolster the packaging industry there. Take Hisilicon for example, its high-end IC is all produced by Taiwan's TSMC, packaged by ASE and SPIL, and tested by SPIL and KYEC.
1. Global Semiconductor Industry
1.1 Overview
1.2 Supply Chain
1.3 Semiconductor Packaging Introduction
2. Upstream & Downstream of IC Packaging Industry
2.1 Semiconductor Industry by Location
2.2 Semiconductor Industry Capital Spending Trend
2.3 DRAM Industry
2.3.1 Status Quo
2.3.2 Market Share of DRAM Vendors
2.3.3 Market Share of Mobile DRAM Vendors
2.4 NAND Flash
2.5 Wafer Foundry Industry
2.6 Wafer Foundry Competition
2.7 Wafer Foundry Industry Ranking
2.8 Mobile Phone Market
2.9 PC Market
2.10 Tablet PC Market
2.11 FPGA and CPLD Market
3. Packaging & Testing Technology Trend
3.1 Wide IO/HMC Memory
3.2 Embedded Component Substrate
3.3 Embedded Trace Substrate
3.4. IC Packaging for Handset
3.4.1 Status Quo
3.4.2 PoP Packaging
3.4.3 FOWLP
3.5 SIP Packaging
3.5.1 Murata
3.5.2 USI(Taiwan)
3.6 2.5D Packaging (SI/GLASS/ORGANIC INTERPOSER)
3.6.1 Introduction
3.6.2 Application
3.6.3 2.5D Interposer Market Size
3.6.4 Suppliers
3.7 TSV (3D) Packaging
3.7.1 Equipment
4. Packaging & Testing Industry
4.1 Market Size
4.2 Middle-end Packaging &Testing Industry
4.3 OSAT Industry by Region
4.4 Semiconductor Testing
4.5 Global Vendor Ranking
5. Packaging & Testing Vendors
5.1 ASE
5.2 Amkor
5.3 SPIL
5.4 STATS ChipPAC
5.5 PTI
5.6 Greatek
5.7 ChipMOS
5.8 KYEC
5.9 Unisem
5.10 FATC
5.11 JECT
5.12 UTAC
5.13 Lingsen Precision
5.14 Nantong Fujitsu Microelectronics
5.15 Walton Advanced Engineering
5.16 Chipbond
5.17 J-DEVICES
5.18 MPI
5.19 STS Semiconductor
5.20 Signetics
5.21 Hana Micron
5.22 Nepes
5.23 Tian Shui Hua Tian Technology
Global 3G/4G Mobile Phone Shipments, 2011-2014
Semiconductor Industry Growth versus Worldwide GDP Growth, 1990-2014
Quarterly Revenue of Global Semiconductor Industry, 2012-2014
Global Semiconductor Market Structure by Product, 2012-2017E
Market Size Growth of Global Semiconductor Market by Product, 2012-2017E
Semiconductor Outsourced Supply Chain
Semiconductor Company Systems
Semiconductor Outsourced Supply Chain Example
Top25 Semiconductor Sales Leaders, 1Q2014
Worldwide IC Sales by Company Headquarters Location, 1990-2013
Fabless IC Sales Market Share by Company Headquarters Location, 2013
Top 10 IC Manufacturers in China, 2008-2013
Top 10 Spenders Capital Spending Outlook, 2011-2014E
Top 5 Share of Total Semiconductor Capital Spending, 1994-2013
Global DRAM and NAND Market Size, 2008-2016E
DRAM Supply/Demand, 1Q2012-4Q2014
DRAM CAPEX, 2005-2015E
ASP of DDR3 4Gb, 2012-2014
ASP of NAND MLC 32Gb, 2012-2014
Revenue Ranking for Branded DRAM Vendor, 2Q2013-1Q2014
DRAM Market Share, Q12007-Q12014
Mobile DRAM Market Share, 2009-2011
Mobile DRAM Market Share, 2012
Revenue Ranking for Branded Mobile DRAM Vendors, 2Q2013-1Q2014
Market Share of Branded NAND Flash Vendors, 2012
Market Share of Branded NAND Flash Vendors, 1Q 2014
NAND Supply/Demand, 1Q2012-4Q2014
NAND Tech Migration Roadmap
Global Foundry Market Size, 2008-2017E
Foundry Revenue of Advanced Nodes, 2012-2017E
Global Foundry Capacity by Node, 2012-2018E
Global Foundry Revenue by Node, 2012-2018E
Global Ranking by Foundry
Average IC Cost of Mobile Phone, 2008-2016E
Global Mobile Phone Shipments, 2007-2015E
Worldwide Smartphone Sales to End Users by Vendor, 2013 (Thousands of Units)
Worldwide Smartphone Sales to End Users by Operating System, 2013 (Thousands of Units)
Worldwide Mobile Phone Sales to End Users by Vendor, 2013 (Thousands of Units)
Global PC-used CPU and Discrete GPU Shipments, 2008-2015E
Global Notebook Computer Shipments, 2008-2015E
Global Major Notebook Computer ODM Shipments, 2010-2013
Global Tablet PC Shipments, 2011-2016E
Market Share of Major Tablet PC Brands, 2013
Output of Global Tablet PC Vendors, 2012-2013
FPGA and CPLD Market Distribution by Application and Region, 2011
Market Share of Major FPGA Vendors, 1999-2013
Mobile DRAM Trend
Advantages of WIDE IO
SK Hynix WIDE IO2 Roadmap
HMC Architecture
HMC Benefits
Advantages of Embedded Passive/Active Substrate
Embedded Component Substrate Process
Comparison of Embedded Active & Passive Components
Roadmap of Embedded Passive Substrate
Structure Roadmap of Embedded Active Substrate
FOWLP and PLP Process Comparison
WHY Embedded Trace?
Embedded Trace Package Features
Embedded Trace Package Sweet Spot (for Wire Bonding)
Embedded Trace Package Sweet Spot (for FLIP CHIP)
Apple iPad 4 LTE A1459 IC Package Type List
PoP Package Development Trend
Market Share of Major SiP Packaging Vendors, 2014
Murata Sales and Operation Margin, FY2009-FY2014
Murata Sales by Region, FY2009-FY2014
Sales, New Orders and Backlog of Murata, 1Q2011-2Q2014
Operating Income and Net Income of Murata, 1Q2011-2Q2014
Murata Order by Product, 1Q2011-2Q2014
Murata Sales by Product, FY2010-FY2014
Murata Sales by Application, FY2010-FY2014
Revenue and Gross Margin of USI (Taiwan), 2008-2014
Quarterly Revenue and Gross Margin of USI (Taiwan), 1Q2013-2Q2014
Quarterly Revenue of USI (Taiwan) by Product, 1Q2013-2Q2014
Revenue and Operating Margin of USI, 2008-2014
Revenue of USI by Application, 2011-2013
Output of USI by Product, 2011-2013
2.5D Interposer Manufacturing Revenue
Breakdown by Interposer Bulk Material, 2010-2017E
TSV Application
TSV Equipment Suppliers
TSV Packaging Equipment Distribution, 2012-2017E
OSAT Market Size, 2006-2015E
Share of IC Package Added Value, 1990-2020E
Global IC Packaging Shipment by Type, 2011\2016
Middle-End Packaging & Testing Process
Global OSAT Output Value by Region, 2012
Global OSAT Output Value by Region, 2014
Taiwan Packaging & Testing Industry Revenue, 2007-2014
Top 7 Packaging & Testing Vendors in S.Korea by Revenue, 2011-2013
FIQFN Vendors Ranking, 2013
FOWLP Vendors Ranking, 2013
Stacked Package Vendors Ranking, 2013
Revenue and Operating Margin of Global Top 24 Packaging & Testing Vendors, 2008-2012
Global Top24 OSAT Company Ranking by Revenue, 2013-2014
Comparison of Operating Margin and Gross Margin between Global Major OSAT Vendors, 2013-2014
Organizational Structure of ASE
Revenue and Gross Margin of ASE, 2001-2014
Revenue and Operating Margin of ASE, 2009-2014
Monthly Revenue of ASE, May 2012-June 2014
Revenue and Gross Margin of ASE Packaging, Q1 2013-Q2 2014
Revenue of ASE Packaging by Type, Q1 2013-Q2 2014
Revenue and Gross Margin of ASE Tests, Q1 2013-Q2 2014
Revenue and Gross Margin of ASE Material, Q1 2013-Q2 2014
Revenue and Gross Margin of ASE EMS, Q1 2013-Q2 2014
Revenue Breakdown of ASE EMS, Q1 2013-Q2 2014
Machinery & Equipment Capital Expenditure vs. EBITDA of ASE, Q1 2013-Q2 2014
Revenue of ASE by Application, Q1 2014
Major Clients of ASE
Revenue of Amkor by Package Type, 2007-2014
Shipments of Amkor by Package Type, 2012-2014
Revenue of Amkor by Application, 2012-2014
Revenue, Gross Margin and Operating Margin of Amkor, 2005-2014
Capital Intensity of Amkor, 2011-2014
Debt and Cash of Amkor, 2011-2014
Property, Plant and Equipment by Region of Amkor, 2012-2013
Revenue and Shipments of Amkor by Region, 2011-2013
Net Sales of Amkor by Country Based on Customer Location, 2011-2014
Organizational Structure of SPIL
Monthly Revenue of SPIL, May 2012-June 2014
Quarterly Revenue, Gross Margin and Operating Margin of SPIL, 1Q2012-2Q2014
Revenue of SPIL by Region, 2005- 2014
Revenue of SPIL by Application, 2005- 2014
Revenue of SPIL by Business, 2005-2014
Capacity of SPIL, 2006-2014
Revenue, Gross Margin and Operating Margin of SPIL, 2003-2014
Revenue and Gross Margin of STATS ChipPAC, 2004-2014
Revenue of STATS ChipPAC by Package Type, 2006-2013
Revenue of STATS ChipPAC by Application, 2006- 2013
Revenue of STATS ChipPAC by Region, 2006-2013
Revenue and Operating Margin of PTI, 2006-2014
Revenue and Gross Margin of PTI, 2009-2014
Monthly Revenue and Growth of PTI, June 2012-June 2014
PTI Factories
TSV Solutions of PTI
Revenue of PTI by Business, 2011-2014
Revenue of PTI by Product, 2011-2014
Revenue, Gross Margin and Operating Margin of Greatek, 2005-2014
Revenue of Greatek by Technological Type, 2007-2010
Monthly Revenue and Growth Rate of Greatek, June 2012-June 2014
Revenue and Gross Margin of ChipMOS, 2003-2014
Revenue and Operating Margin of ChipMOS, 2009-2014
Revenue of ChipMOS by Business, 2010-2014
Revenue of ChipMOS by Product, 2010-2014
Utilization Rate and EBITDA Margin of ChipMOS, 2010-2014
Cash Flow and CAPEX of ChipMOS, 2009-2013
ChipMOS Technology Roadmap, 2014-2016E
ChipMOS Technology Development & Business Alignment, 2014-2016E
ChipMOS LCD Driver Capacity, 2010-2013
Revenue of ChipMOS by Client, 2013
Revenue of ChipMOS by Region, 2006-2013
Category Distribution of Active Patents of ChipMOS
Revenue and Gross Margin of KYEC, 2003-2014
Revenue and Operating Margin of KYEC, 2009-2014
Monthly Revenue of KYEC, June 2012-June 2014
KYEC Plants
KYEC Testing Platforms
Revenue and EBITDA of Unisem, 2006-2014
Revenue and EBITDA of Unisem, Q1 2011-Q1 2014
Revenue of Unisem by Product, Q2 2012-Q1 2014
Revenue of Unisem by Market, Q2 2012-Q1 2014
Organizational Structure of Formosa Plastics Group
Organizational Structure of FATC
Revenue and Operating Margin of FATC, 2006-2014
Revenue and Gross Margin of FATC, 2009-2014
Monthly Revenue of FATC, June 2012-June 2014
Revenue and Operating Margin of JECT, 2006-2014
Output and Sales Volume of JECT, 2011-2013
Cost Structure of JECT, 2012-2013
Revenue of JCET by Product, 2013-2014
Global CU Pilluar Capacity Distribution of JECT, 2012
Balance Sheet of JECT, 2009-2013
Package Cost Structure of JECT, 2011-2012
JCET ROADMAP
Revenue of JCET by Region, 2011
Revenue and Gross Margin of UTAC, 2010-2014
Revenue of UTAC by Business, 2010-2013
Revenue of UTAC by Region, 2010-2013
Revenue of UTAC by Product, 2010-2013
Revenue of UTAC by Client, 2010-2013
Revenue and Operating Margin of LINGSEN, 2007-2014
Revenue and Gross Margin of LINGSEN, 2009-2014
Monthly Revenue of LINGSEN, June 2012-June 2014
Revenue and Operating Income of Nantong Fujitsu Microelectronics, 2007-2014
Revenue and Operating Margin of Nantong Fujitsu Microelectronics, 2007-2014
Revenue and Operating Margin of Walton Advanced Engineering, 2007-2014
Revenue and Gross Margin of Walton Advanced Engineering, 2009-2014
Monthly Revenue and Growth Rate of Walton Advanced Engineering, June 2012-June 2014
Revenue and Operating Margin of Chipbond, 2006-2014
Revenue and Gross Margin of Chipbond, 2009-2014
Monthly Revenue and Growth Rate of Chipbond, June 2012-June 2014
Revenue of Chipbond by Business, 2012
Revenue of Chipbond by Market, 2012-2013
Global Gold Bumping Vendor Capacity Share, 2013
Organizational Structure of J-DEVICES
Revenue and PBT of MPI, FY2007-FY2014
Equity and Assets of MPI, FY2009-FY2013
Revenue of MPI by Region, FY2011-FY2013
Revenue of Carsem by Product, Q1 2011-Q1 2012
Organizational Structure of STS Semiconductor
Revenue and Operating Margin of STS Semiconductor, 2006-2014
Revenue of STS Semiconductor by Business, 2011-2013
Capacity of STS Semiconductor, 2011-2013
Output of STS Semiconductor, 2011-2013
Shareholder Structure of Signetics
Revenue and Operating Margin of Signetics, 2007-2014
Revenue and Operating Margin of Hana Micron, 2006-2014
Revenue of Hana Micron by Client, 2013
Revenue of Hana Micron by Market, 1Q2013-4Q2014
Revenue and Operating Margin of Nepes, 2007-2014
Quarterly Revenue of Nepes by Division, 2013-2014
Revenue and Operating Margin of Tian Shui Hua Tian Technology, 2006-2014
Global and China CMOS Camera Module (CCM) Industry Report, 2020-2026
The global CCM market has been ballooning thanks to expeditious penetration of multi-camera phones and advances in automotive ADAS, being worth $22.723 billion with a year-on-year spike of 16.6% in 20...
Global and China Multi-Layer Ceramic Capacitor (MLCC) Industry Report, 2020-2025
Electronic components like MLCC enjoy a rosy prospect alongside the burgeoning electronic manufacturing, the thriving internet and the prevalence of smart hardware.
MLCC was much sought after and it...
Global and China Voice Coil Motor (VCM) Industry Report, 2019-2025
VCM (voice circle motor or voice coil actuator), a part for smartphone camera, shares around 6% of smartphone camera industry chain value.
Globally, popularity of smartphones such as those with mult...
Global and China Aluminum Electrolytic Capacitor Industry Report, 2019-2025
Chinese aluminum electrolytic capacitor market has been expanding amid a transfer of its downstream industries to China like home appliance illumination, cellphones and computers as well as automatic ...
Global and China Flexible Printed Circuit (FPC) Industry Report, 2019-2025
Flexible printed circuit (FPC) products make their way into consumer electronics like smartphone and tablet PC, in the form of modules for display, touch control, fingerprint recognition, etc. The vol...
Global and China GaAs Industry Report, 2019-2025
Gallium arsenide (GaAs), one of the most mature compound semiconductors, is an integral part of smartphone power amplifier (PA). In 2018, GaAs-based radio frequency (RF) seized over half of the GaAs w...
Global and China Advanced Packaging Industry Report, 2019-2025
The global semiconductor packaging and testing market is enlarging with the prevalence of consumer electronics, automotive semiconductors and the Internet of Things (IoT), with its size edging up 2.5%...
Global and China MLCC Electronic Ceramics Industry Report, 2019-2025
MLCC is mainly used in audio and video equipment, mobile phones, computers and automobiles. The prospective boom of MLCC formula powder hinges on demand: 1) The accelerated renewal of consumer electro...
Global and China OLED Industry Report, 2019-2025
OLED, a new-generation display technology, features simple display structure, green consumables and flexibility and can be rolled up, which makes it easier to transport and install without considering...
Global and China Camera Module Industry Report, 2019-2025
Affected by factors like the maturity of mobile phone markets worldwide and the prolonged replacement of mobile phone by users, the mobile phone market has undergone a slowdown in growth rate. From Q4...
Global and China Multi-Layer Ceramic Capacitor (MLCC) Industry Report, 2018-2023
MLCC finds most application in consumer electronics, automobile and industrial fields and gets beefed up remarkably with the approaching 5G era of cellphones and tablet PCs, the advances in automotive...
Global and China Aluminum Electrolytic Capacitor Industry Report, 2018-2023
Aluminum electrolytic capacitor, a core electronic component, is widely used in consumer electronics, computers and peripherals, industry, electric power, lighting and automobiles.
Global aluminum e...
Global and China CMOS Camera System Industry Report, 2017-2021
Global CCM (CMOS Camera Module) market was worth USD16.611 billion in 2015, a year-on-year rise of 3.8% from 2014, the slowest rate since 2010. Global market fell modestly in 2016 due to a drop in shi...
Global and China Organic Light-Emitting Diode (OLED) Industry Report, 2017-2021
Global OLED market size approximated USD15.7 billion in 2016, a 20.8% rise from a year earlier. Stimulated by reports that Apple will adopt OLED screen for multiple iPhone models in 2017-2018, OLED sc...
Global and China CMOS Camera System Industry Report, 2016-2020
Global and China CMOS Camera System Industry Report, 2016-2020 covers the following:1. Analysis of CMOS Image Sensor (CIS) Industry and Market, with 7 vendors involved.2. Analysis of CMOS Camera Lens ...
Global and China Multi-layer Ceramic Capacitor (MLCC) Industry Report, 2017-2020
The rapid development of consumer electronics and industrial intelligentization has greatly promoted the booming of passive components including multi-layer ceramic capacitor (MLCC). In 2015, China’s ...
Global PCB Industry Report, 2015-2020
Global PCB Industry Report, 2015-2020 highlights the followings:1. Global PCB Market and Status Quo of the Industry2. Global Downstream Markets of PCB3. Mobile Phone PCB Trends4. Tablet PC/Laptop Comp...
Global and China Organic Light-Emitting Diode (OLED) Industry Report, 2016-2020
The OLED market has been developing rapidly worldwide over the recent years, and its market size reached USD13 billion in 2015. With technology and capacity construction, OLED (from small-sized panels...