China Bus Industry Report, 2017-2021
-
Aug.2017
- Hard Copy
- USD
$2,700
-
- Pages:115
- Single User License
(PDF Unprintable)
- USD
$2,500
-
- Code:
ZJF107
- Enterprise-wide License
(PDF Printable & Editable)
- USD
$3,900
-
- Hard Copy + Single User License
- USD
$2,900
-
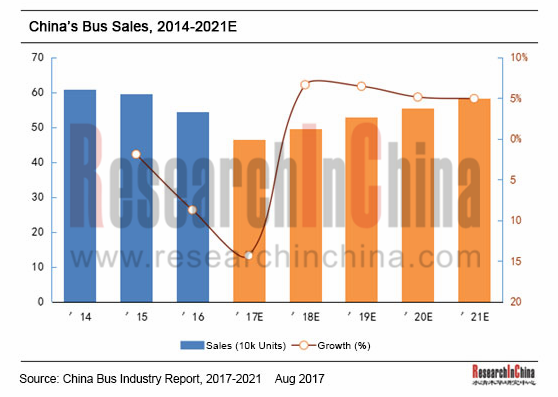
China bus industry has entered a period of adjustment in recent years following a phase of rapid growth with bus output and sales presenting downward trends (a year-on-year fall of 7.4% and 8.7% in 2016 and 15.3% and 14.0% in the first half of 2017, respectively). Over the next couple of years, the bus market may well decline due to smaller new energy vehicle subsidies, higher technical barriers and competition from high-speed rail; however, urban bus network and alternative demand from new energy vehicles can still provide some impetus to the bus industry. Hence, the country’s output and sales of bus are expected to reach 572,400 units and 582,700 units in 2021, representing a CAGR of 0.9% and 1.4% over 2016, respectively.
?
Market structure: Large and medium-sized buses grew rapidly while light bus fell at a faster rate in 2016. The output and sales of large bus were 90,200 units and 90,400 units, up 5.23% and 6.91% year on year, respectively; for medium-sized bus, 99,000 units were produced and 99,400 units sold, a 26.60% and 26.07% rise over the previous year separately; regarding light bus, 357,700 units were produced and 353,600 units sold, down 16.22% and 18.14% from a year ago individually. The bus market slid across the board in the first half of 2017 with the output and sales of large bus going down 18.26% and 17.38% to 28,500 units and 27,900 units respectively, of medium-sized bus down 37.54% and 36.36% to both 26,000 units, and of light bus down 9.71% and 8.32% to 164,200 units and 166,500 units separately, all on year-on-year basis.
Competitive landscape: relatively stable but highly concentrated. In 2016, top10 bus makers seized a combined market share of 71.47% and top5 ones 49.58%. With complete product lines (large, medium-sized and light buses), Yutong Bus and Xiamen King Long Motor Group retained the top spots, while JMC, Shenyang Jinbei Automotive and Beiqi Foton Motor, by virtue of their numerical advantage of light bus, joined the top5 positions.
China Bus Industry Report, 2017-2021 highlights the following:
 Overview of the bus industry (definition & classification, development trends, industry policies, etc.);
Overview of the bus industry in China (output & sales, ownership, etc.);
Bus market segments (large, medium-sized and light buses) (output & sales, competitive landscape, etc.);
Chinese new energy bus market (output & sales, competitive landscape, industry policies, etc.);
Bus industry chain in China (raw material markets, application markets, etc.);
16 makers including Yutong Bus, Zhongtong Bus, Xiamen King Long Motor Group, Dongfeng Automobile, Beiqi Foton Motor, JMCG and JAC (profile, financial position, output & sales, hit products, production bases, latest developments, etc.).
1 Industry Overview
1.1 Introduction to Product
1.2 Product Classification
1.3 Policies
1.4 Active Safety and Connected Car
1.4.1 Policy and Planning
1.4.2 Technical Standards
1.4.3 Enterprises’ Layout
2 Chinese Bus Market
2.1 Market Size
2.2 Market Structure
2.3 Competitive Landscape
2.3.1 Market Share
2.3.2 Performance Comparison
2.4 Market Segments
2.4.1 Coach
2.4.2 Public Bus
2.4.3 School Bus
2.5 Natural-gas Bus
3 Chinese Bus Market Segments
3.1 Large Bus
3.1.1 Market Size
3.1.2 Competitive Landscape
3.2 Medium-sized Bus
3.2.1 Market Size
3.2.2 Competitive Landscape
3.3 Light Bus
3.3.1 Market Size
3.3.2 Competitive Landscape
4 New Energy Bus Market
4.1 Market Size
4.2 Competitive Landscape
4.3 Industry Policies
4.3.1 Policies on Fiscal Subsidies
4.3.2 Policy of Cutting Subsidies for Diesel Oil and Increasing Subsidies for Electric Bus
4.3.3 Promotion and Assessment Methods
4.4 Technical Routes
4.5 Fuel-cell Bus
5 Bus Market Industry Chain
5.1 Upstream Raw Material Market
5.2 Key Components
5.2.1 Transmission
5.2.2 Wheel
5.2.3 New Energy Battery
5.3 Downstream Demand Market
5.3.1 Passenger Transport
5.3.2 High-speed Rail
5.3.3 Tourism
6 Major Enterprises
6.1 Zhengzhou Yutong Bus Co., Ltd.
6.1.1 Profile
6.1.2 Financial Position
6.1.3 Operating Revenue Structure
6.1.4 Output and Sales
6.1.5 New Energy Bus
6.1.6 Production Capacity
6.1.7 R&D Costs
6.1.8 Cost Structure
6.1.9 Components & Parts
6.1.10 Developments
6.1.11 Operational Prospects
6.2 Xiamen King Long Motor Group
6.2.1 Profile
6.2.2 Financial Position
6.2.3 Operating Revenue Structure
6.2.4 Operation of Major Subsidiaries
6.2.5 Output and Sales
6.2.6 New Energy Bus
6.2.7 Production Capacity
6.2.8 R&D Costs
6.2.9 Cost Structure
6.2.10 Developments
6.2.11 Operational Prospects
6.3 Zhongtong Bus and Holding Co., Ltd.
6.3.1 Profile
6.3.2 Financial Position
6.3.3 Operating Revenue Structure
6.3.4 Output and Sales
6.3.5 New Energy Bus
6.3.6 R&D Costs
6.3.7 Cost Structure
6.3.8 Developments
6.3.9 Operational Prospects
6.4 Beiqi Foton Motor Co., Ltd.
6.4.1 Profile
6.4.2 Financial Position
6.4.3 Operating Revenue Structure
6.4.4 Output and Sales
6.4.5 New Energy Bus
6.4.6 Production Capacity
6.4.7 R&D Costs
6.4.8 Operational Prospects
6.5 Anhui Ankai Automobile Co., Ltd.
6.5.1 Profile
6.5.2 Financial Position
6.5.3 Operating Revenue Structure
6.5.4 Output and Sales
6.5.5 New Energy Bus
6.5.6 Production Capacity
6.5.7 R&D Costs
6.5.8 Cost Structure
6.6 Liaoning SG Automotive Group Co., Ltd.
6.6.1 Profile
6.6.2 Financial Position
6.6.3 Operating Revenue Structure
6.6.4 Output and Sales
6.6.5 New Energy Business
6.6.6 Cost Structure
6.7 Yangzhou Asiastar Bus Co., Ltd.
6.7.1 Profile
6.7.2 Financial Position
6.7.3 Operating Revenue Structure
6.7.4 Output and Sales
6.7.5 New Energy Bus
6.7.6 R&D Costs
6.7.7 Cost Structure
6.8 BYD
6.8.1 Profile
6.8.2 Financial Position
6.8.3 Operating Revenue Structure
6.8.4 Output and Sales
6.8.5 New Energy Bus
6.8.6 Developments
6.9 Anhui Jianghuai Automobile Co., Ltd.
6.9.1 Profile
6.9.2 Financial Position
6.9.3 Operating Revenue Structure
6.9.4 Output and Sales
6.9.5 R&D Costs
6.9.6 Cost Structure
6.9.7 Operational Prospects
6.10 Shenyang Jinbei Automotive Co., Ltd.
6.10.1 Profile
6.10.2 Financial Position
6.10.3 Operating Revenue Structure
6.10.4 Output and Sales
6.10.5 R&D Costs
6.10.6 Cost Structure
6.10.7 Operational Prospects
6.11 Jiangling Motors Co., Ltd.
6.11.1 Profile
6.11.2 Financial Position
6.11.3 Operating Revenue Structure
6.11.4 Output and Sales
6.11.5 R&D Costs
6.11.6 Operational Prospects
6.12 Dongfeng Motor Corporation
6.12.1 Profile
6.12.2 Financial Position
6.12.3 Operating Revenue Structure
6.12.4 Output and Sales
6.12.5 R&D Costs
6.12.6 Cost Structure
6.12.7 Operational Prospects
Intelligent Operational Systems of Major Bus Enterprises in China
China’s Bus Output and Sales, 2005-2021E
Chinese Bus Market Structure, 2005-2021E
Top10 Bus Enterprises in China, 2014
Top10 Bus Enterprises in China, 2015
Top10 Bus Enterprises in China, 2016
Top10 Bus Enterprises in China, 2017
Revenue of Major Bus Enterprises in China, 2014-2017
Net Income of Major Bus Enterprises in China, 2014-2017
Gross Margin of Major Bus Enterprises in China, 2014-2017
Bus Sales in China by Application, 2014-2016
Chinese Large and Medium-sized Coach Market Structure by Application, 2016
Public Bus Sales in China, 2014-2016
School Bus Sales in China, 2009-2016
Natural-gas Bus Sales in China, 2014-2017
Large Bus and Chassis Output in China, 2005-2021E
Large Bus and Chassis Sales in China, 2005-2021E
Top10 Large Bus Makers in China, 2014
Market Share of Large Bus Chassis Enterprises in China, 2014
Top10 Large Bus Makers in China, 2015
Market Share of Large Bus Chassis Enterprises in China, 2015
Top10 Large Bus Makers in China, 2016
Market Share of Large Bus Chassis Enterprises in China, 2016
Top10 Large Bus Makers in China, 2017
Market Share of Large Bus Chassis Enterprises in China, 2017
Medium-sized Bus and Chassis Output in China, 2005-2021E
Medium-sized Bus and Chassis Sales in China, 2005-2021E
Top10 Medium-sized Bus Makers in China, 2014
Market Share of Medium-sized Bus Chassis Enterprises in China, 2014
Top10 Medium-sized Bus Makers in China, 2015
Market Share of Medium-sized Bus Chassis Enterprises in China, 2015
Top10 Medium-sized Bus Makers in China, 2016
Market Share of Medium-sized Bus Chassis Enterprises in China, 2016
Top10 Medium-sized Bus Makers in China, 2017
Market Share of Medium-sized Bus Chassis Enterprises in China, 2017
Light Bus and Chassis Output in China, 2005-2021E
Light Bus and Chassis Sales in China, 2005-2021E
Top10 Light Bus Makers in China, 2014
Market Share of Light Bus Chassis Enterprises in China, 2014
Top10 Light Bus Makers in China, 2015
Market Share of Light Bus Chassis Enterprises in China, 2015
Top10 Light Bus Makers in China, 2016
Market Share of Light Bus Chassis Enterprises in China, 2016
Top10 Light Bus Makers in China, 2017
Market Share of Light Bus Chassis Enterprises in China, 2017
New Energy Bus Output in China, 2016-2017
Top20 New Energy Bus Makers in China by Output, 2016-2017
Top20 Battery Electric Bus Makers in China by Output, 2016-2017
Top20 Plug-in Hybrid Bus Makers in China by Output, 2016-2017
Subsidy Standards for Electric Bus, 2017
Raw Material Costs of Major Bus Makers in China, 2014-2016
Market Share of Major Commercial Vehicle Transmission Producers in China
Major Suppliers of Commercial Vehicle Transmission in China
Wheel Hub Suppliers of Major Bus Makers in China
Highway Passenger Transportation in China, 2004-2017
High-speed Rail Mileage in China, 2013-2016
Total Tourism Revenue in China, 2001-2016
Number of Tourists during the Chinese Golden Week Holiday, 2008-2017
Main Financial Indicators of Yutong Bus, 2012-2017
Operating Revenue Structure of Yutong Bus by Business, 2013-2016
Operating Revenue Structure of Yutong Bus by Region, 2013-2016
Output and Sales of Yutong Bus by Product, 2012-2017
Sales Structure of Yutong Bus, 2015-2016
New Energy Bus Output of Yutong Bus, 2014-2017
New Energy Bus Sales of Yutong Bus, 2012-2016
New Energy Bus Sales of Yutong Bus by Type, 2015-2016
R&D Costs of Yutong Bus, 2009-2016
Product Cost Structure of Yutong Bus, 2014-2016
Revenue, Net Income, and Gross Margin of Yutong Bus, 2015-2021E
Main Financial Indicators of Xiamen King Long Motor Group, 2012-2017
Operating Revenue and Gross Margin of Xiamen King Long Motor Group's Major Products, 2015-2016
Operating Revenue Structure of Xiamen King Long Motor Group by Region, 2013-2016
Revenue and Net Income of Major Subsidiaries of Xiamen King Long Motor Group, 2014-2016
Bus Output of Subsidiaries of Xiamen King Long Motor Group, 2012-2017
Bus Sales of Subsidiaries of Xiamen King Long Motor Group, 2012-2017
Truck Output and Sales of Xiamen King Long Motor Group, 2012-2017
New Energy Bus Output of Xiamen King Long Motor Group, 2014-2017
New Energy Bus Sales of Xiamen King Long Motor Group by Length, 2015-2016
New Energy Bus Sales of Xiamen King Long Motor Group by Application, 2015-2016
Percentage of Key Parts Purchased by Xiamen King Long Motor Group for New Energy Bus
R&D Costs of Xiamen King Long Motor Group, 2010-2016
Cost Structure of Xiamen King Long Motor Group, 2013-2016
Revenue, Net Income, and Gross Margin of Xiamen King Long Motor Group, 2015-2021E
Main Financial Indicators of Zhongtong Bus, 2012-2017
Operating Revenue Structure of Zhongtong Bus by Business, 2013-2016
Operating Revenue Structure of Zhongtong Bus by Region, 2013-2016
Output and Sales of Zhongtong Bus, 2012-2017
New Energy Bus Output of Zhongtong Bus, 2014-2017
R&D Costs of Zhongtong Bus, 2012-2016
Cost Structure of Zhongtong Bus, 2013-2016
Revenue, Net Income, and Gross Margin of Zhongtong Bus, 2015-2021E
Main Financial Indicators of Beiqi Foton Motor, 2010-2017
Operating Revenue Structure of Beiqi Foton Motor by Business, 2014-2016
Operating Revenue Structure of Beiqi Foton Motor by Region, 2013-2016
Bus Output and Sales of Beiqi Foton Motor by Type, 2012-2017
New Energy Bus Output of Beiqi Foton Motor, 2014-2017
New Energy Bus Sales of FOTON AUV, 2013-2016
R&D Costs of Beiqi Foton Motor, 2010-2016
Revenue, Net Income, and Gross Margin of Beiqi Foton Motor, 2015-2021E
Financial Indicators of Anhui Ankai Automobile, 2012-2017
Operating Revenue Structure of Anhui Ankai Automobile by Business, 2015-2016
Operating Revenue Structure of Anhui Ankai Automobile by Region, 2013-2016
Output and Sales of Anhui Ankai Automobile, 2012-2017
New Energy Bus Output of Anhui Ankai Automobile, 2014-2017
R&D Costs of Anhui Ankai Automobile, 2010-2016
Cost Structure of Anhui Ankai Automobile, 2015-2016
Financial Indicators of SG Automotive Group, 2012-2017
Operating Revenue Structure of SG Automotive Group by Business, 2013-2016
Operating Revenue Structure of SG Automotive Group by Region, 2013-2016
Huanghai Bus Output and Sales Volume of SG Automotive Group, 2012-2017
Huanghai New Energy Bus Output of SG Automotive Group, 2014-2017
Cost Structure of SG Automotive Group, 2014-2016
Financial Indicators of Asiastar Bus, 2012-2017
Operating Revenue Structure of Asiastar Bus by Business, 2013-2016
Operating Revenue Structure of Asiastar Bus by Region, 2013-2015
Output and Sales of Asiastar, 2012-2017
New Energy Bus Sales Volume of Asiastar, 2014-2016
Asiastar’s Income from New Energy Bus Subsidies, 2015-2016
R&D Costs of Asiastar, 2010-2016
Cost Structure of Asiastar, 2014-2016
Financial Indicators of BYD, 2012-2017
Operating Revenue Structure of BYD by Business, 2013-2016
Operating Revenue Structure of BYD by Region, 2015-2016
Bus Output and Sales Volume of BYD, 2012-2017
Main New Energy Buses of BYD
Capacity and Output of BYD’s Major New Energy Bus Bases, 2016
Key Orders of BYD, 2016
Financial Indicators of JAC, 2012-2017
Operating Revenue Structure of JAC by Business, 2015-2016
Operating Revenue Structure of JAC by Region, 2013-2016
Bus Output and Sales of JAC, 2012-2017
R&D Costs of JAC, 2010-2016
Cost Structure of JAC, 2016
Revenue, Net Income, and Gross Margin of JAC, 2014-2021E
Financial Indicators of Jinbei Auto, 2012-2017
Operating Revenue Structure of Jinbei Auto by Business, 2013-2016
Operating Revenue Structure of Jinbei Auto by Region, 2013-2016
Commercial Vehicle Output and Sales of Jinbei Auto, 2012-2017
R&D Costs of Jinbei Auto, 2012-2016
Cost Structure of Jinbei Auto, 2014-2016
Revenue, Net Income, and Gross Margin of Jinbei Auto, 2015-2021E
Financial Indicators of JMC, 2012-2017
Operating Revenue Structure of JMC by Business, 2013-2016
Bus Output and Sales of JMC, 2012-2017
R&D Costs of JMC, 2010-2016
Revenue, Net Income, and Gross Margin of JMC, 2015-2021E
Financial Indicators of Dongfeng Motor, 2012-2017
Operating Revenue Structure of Dongfeng Motor by Business, 2013-2016
Operating Revenue Structure of Dongfeng Motor by Region, 2013-2016
Bus Output and Sales of Dongfeng Motor, 2012-2017
R&D Costs of Dongfeng Motor, 2010-2016
Cost Structure of Dongfeng Motor, 2014-2016
Revenue, Net Income, and Gross Margin of Dongfeng Motor, 2015-2021E
Bus Output and Sales of SAIC MAXUS, 2012-2017
Capacity of SAIC MAXUS (including New Energy), 2016
Ongoing Projects of SAIC MAXUS, 2016
New Energy Vehicle Output, Sales Volume, and Revenue of SAIC MAXUS, 2015-2016
China Automotive Lighting and Ambient Lighting System Research Report, 2025
Automotive Lighting System Research: In 2025H1, Autonomous Driving System (ADS) Marker Lamps Saw an 11-Fold Year-on-Year Growth and the Installation Rate of Automotive LED Lighting Approached 90...
Ecological Domain and Automotive Hardware Expansion Research Report, 2025
ResearchInChina has released the Ecological Domain and Automotive Hardware Expansion Research Report, 2025, which delves into the application of various automotive extended hardware, supplier ecologic...
Automotive Seating Innovation Technology Trend Research Report, 2025
Automotive Seating Research: With Popularization of Comfort Functions, How to Properly "Stack Functions" for Seating?
This report studies the status quo of seating technologies and functions in aspe...
Research Report on Chinese Suppliers’ Overseas Layout of Intelligent Driving, 2025
Research on Overseas Layout of Intelligent Driving: There Are Multiple Challenges in Overseas Layout, and Light-Asset Cooperation with Foreign Suppliers Emerges as the Optimal Solution at Present
20...
High-Voltage Power Supply in New Energy Vehicle (BMS, BDU, Relay, Integrated Battery Box) Research Report, 2025
The high-voltage power supply system is a core component of new energy vehicles. The battery pack serves as the central energy source, with the capacity of power battery affecting the vehicle's range,...
Automotive Radio Frequency System-on-Chip (RF SoC) and Module Research Report, 2025
Automotive RF SoC Research: The Pace of Introducing "Nerve Endings" such as UWB, NTN Satellite Communication, NearLink, and WIFI into Intelligent Vehicles Quickens
RF SoC (Radio Frequency Syst...
Automotive Power Management ICs and Signal Chain Chips Industry Research Report, 2025
Analog chips are used to process continuous analog signals from the natural world, such as light, sound, electricity/magnetism, position/speed/acceleration, and temperature. They are mainly composed o...
Global and China Electronic Rearview Mirror Industry Report, 2025
Based on the installation location, electronic rearview mirrors can be divided into electronic interior rearview mirrors (i.e., streaming media rearview mirrors) and electronic exterior rearview mirro...
Intelligent Cockpit Tier 1 Supplier Research Report, 2025 (Chinese Companies)
Intelligent Cockpit Tier1 Suppliers Research: Emerging AI Cockpit Products Fuel Layout of Full-Scenario Cockpit Ecosystem
This report mainly analyzes the current layout, innovative products, and deve...
Next-generation Central and Zonal Communication Network Topology and Chip Industry Research Report, 2025
The automotive E/E architecture is evolving towards a "central computing + zonal control" architecture, where the central computing platform is responsible for high-computing-power tasks, and zonal co...
Vehicle-road-cloud Integration and C-V2X Industry Research Report, 2025
Vehicle-side C-V2X Application Scenarios: Transition from R16 to R17, Providing a Communication Base for High-level Autonomous Driving, with the C-V2X On-board Explosion Period Approaching
In 2024, t...
Intelligent Cockpit Patent Analysis Report, 2025
Patent Trend: Three Major Directions of Intelligent Cockpits in 2025
This report explores the development trends of cutting-edge intelligent cockpits from the perspective of patents. The research sco...
Smart Car Information Security (Cybersecurity and Data Security) Research Report, 2025
Research on Automotive Information Security: AI Fusion Intelligent Protection and Ecological Collaboration Ensure Cybersecurity and Data Security
At present, what are the security risks faced by inte...
New Energy Vehicle 800-1000V High-Voltage Architecture and Supply Chain Research Report, 2025
Research on 800-1000V Architecture: to be installed in over 7 million vehicles in 2030, marking the arrival of the era of full-domain high voltage and megawatt supercharging.
In 2025, the 800-1000V h...
Foreign Tier 1 ADAS Suppliers Industry Research Report 2025
Research on Overseas Tier 1 ADAS Suppliers: Three Paths for Foreign Enterprises to Transfer to NOA
Foreign Tier 1 ADAS suppliers are obviously lagging behind in the field of NOA.
In 2024, Aptiv (2.6...
VLA Large Model Applications in Automotive and Robotics Research Report, 2025
ResearchInChina releases "VLA Large Model Applications in Automotive and Robotics Research Report, 2025": The report summarizes and analyzes the technical origin, development stages, application cases...
OEMs’ Next-generation In-vehicle Infotainment (IVI) System Trends Report, 2025
ResearchInChina releases the "OEMs’ Next-generation In-vehicle Infotainment (IVI) System Trends Report, 2025", which sorts out iterative development context of mainstream automakers in terms of infota...
Autonomous Driving SoC Research Report, 2025
High-level intelligent driving penetration continues to increase, with large-scale upgrading of intelligent driving SoC in 2025
In 2024, the total sales volume of domestic passenger cars in China was...