Global and China Cobalt Industry Report, 2017-2021
-
Apr.2017
- Hard Copy
- USD
$2,700
-
- Pages:140
- Single User License
(PDF Unprintable)
- USD
$2,500
-
- Code:
CYH062
- Enterprise-wide License
(PDF Printable & Editable)
- USD
$3,900
-
- Hard Copy + Single User License
- USD
$2,900
-
In recent years, the global refined cobalt market has been in a state of oversupply, but the inventory has been decreasing year by year. In 2016, the global refined cobalt output and consumption were 107,600 tons and 103,800 tons respectively, indicating the excess supply of 3,734 tons which fell 29.3% from the year 2014. In 2017, the global cobalt supply and demand structure will be reversed, with the supply gap of 3,320 tons, because: First, in recent years, the cobalt price has been hovering at a low level, some cobalt mines have reduced or ceased production, and no large cobalt mines have been put into production, resulting in the slowdown of the cobalt supply. Second, the cobalt metal demand has soared quickly as the demand for new energy vehicles continues to grow. It is expected that the global cobalt market will face a tight supply situation in 2017-2021, with the gap of 12,000 tons by 2021.
Affected by the market supply and demand pattern, the prices of cobalt and cobalt products at home and abroad have been rising since July 2016. Till early March 2017, the prices of MB cobalt (high grade) and MB cobalt (low grade) jumped by more than 125% and 117% to USD25.13 / lb and USD23.73 / lb respectively. As the contradiction between supply and demand becomes increasingly prominent, the cobalt price will keep swelling in 2017, but with the relatively low growth rate.
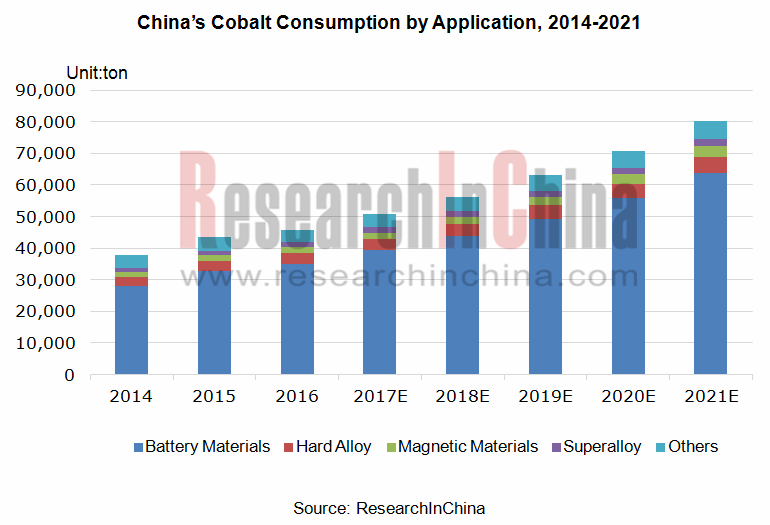
China is the world's largest producer of refined cobalt, with the output of 63,000 tons and holding a global share of 58.6% in 2016; the output is expected to grow to 72,500 tons in 2017. Also, China is the largest consumer of cobalt around the globe, and the consumption increased by 5.3% year on year to 45,800 tons in 2016, accounting for 44.1% of the global total. In 2017-2021, the consumption will keep an AAGR of at least 12%. By 2021, China’s consumption of refined cobalt is expected to exceed 80,000 tons, mainly thanks to the fast-growing new energy vehicle and lithium battery markets.
At present, battery material is a sector where cobalt finds most application in China, accounting for 76.6% in 2016 and potentially 79.0% in 2021.
Amid the relatively stable global cobalt market structure, cobalt mines are mainly occupied by Freeport, Glencore, Umicore, Vale and other foreign companies. In 2016, Freeport ranked first in the world by cobalt output with the share of 11.8%, followed by Glencore with 9.1%.
Chinese cobalt enterprises center on cobalt smelting, and the scale of production has been gradually centralized. Huayou Cobalt, Jinchuan Group, Shenzhen Green Eco-manufacture Hi-tech and other major Chinese cobalt producers have been extending to ternary materials and other cobalt downstream markets through acquisitions, erection of new facilities or other ways as well as raising cobalt capacity. For instance, Shenzhen Green Eco-manufacture Hi-tech raised funds at the end of 2016 to build a 5,000 tons/a nickel cobalt aluminum (NCA) ternary power battery material precursor project in Jingmen, a 15,000 tons/a automotive lithium nickel cobalt manganate ternary power battery material project, etc..
The report focuses on the following:
 Supply, demand, regional distribution, prices, corporate competition pattern and development trends of the global cobalt ore resources, cobalt concentrate and refined cobalt;
China's cobalt ore resources, cobalt supply and demand, product structure, prices, corporate competition pattern and development trends;
Import and export of cobalt concentrate, tricobalt tetroxide, cobalt carbonate, cobalt nitrate and other major cobalt products;
Development and cobalt demand of battery materials, superalloy, hard alloy, magnetic materials and other cobalt downstream industries;
Operation of 4 global cobalt enterprises and their development in China;
Operation and development strategies of 10 key Chinese cobalt enterprises.
1 Cobalt Overview
1.1 Definitions
1.2 Industry Chain
2 Status Quo of Global Cobalt Market
2.1 Cobalt Ore Reserves
2.2 Market Supply
2.3 Market Demand
2.3.1 Demand Value
2.3.2 Demand Structure
2.4 Regional Distribution
2.5 Price
2.6 Competition Pattern
2.7 Development Trend
3 Cobalt Market Development in China
3.1 Overview
3.2 Policy
3.3 Cobalt Ore Resources
3.4 Market Supply and Demand
3.4.1 Supply
3.4.2 Demand
3.4.3 Price
3.4.4 Product Structure
3.5 Competition Pattern
3.6 Development Trend
4 China’s Import and Export of Cobalt by Product
4.1 Cobalt Ores and Concentrates
4.1.1 Import
4.1.2 Regional Structure
4.2 Cobaltosic Oxide
4.2.1 Import and Export
4.2.2 Regional Structure
4.3 Cobalt Chloride
4.3.1 Import and Export
4.3.2 Regional Structure
4.4 Cobalt Carbonate
4.4.1 Import and Export
4.4.2 Regional Structure
4.5 Cobalt Nitrate
4.5.1 Import and Export
4.5.2 Regional Structure
4.6 Cobalt Oxalate
5 Demand of Main Cobalt Downstream Industries
5.1 Battery Materials
5.1.1 Market Development
5.1.2 Demand for Cobalt
5.2 Hard Alloy
5.2.1 Market Development
5.2.2 Demand for Cobalt
5.3 Magnetic Materials
5.3.1 Market Development
5.3.2 Demand for Cobalt
5.4 Superalloy
5.4.1 Market Development
5.4.2 Demand for Cobalt
6 Major Global Cobalt Manufacturers
6.1 Umicore
6.1.1 Profile
6.1.2 Operation
6.1.3 Cobalt Business (Cobalt Specialty Materials)
6.1.4 Business in China
6.1.5 Development Prospect
6.2 Glencore Xstrata
6.2.1 Profile
6.2.2 Operation
6.2.3 Cobalt Business
6.3 Vale
6.3.1 Profile
6.3.2 Operation
6.3.3 Cobalt Business
6.3.4 Business in China
6.4 Freeport
6.4.1 Profile
6.4.2 Operation
6.4.3 Cobalt Business
6.4.4 Business in China
7 Major Chinese Cobalt Producers
7.1 Shenzhen Green Eco-manufacture Hi-tech
7.1.1 Profile
7.1.2 Operation
7.1.3 Cobalt Business
7.1.4 Development Prospect
7.2 Huayou Cobalt
7.2.1 Profile
7.2.2 Operation
7.2.3 Cobalt Business
7.2.4 Development Strategy
7.3 Jinchuan Group Co., Ltd.
7.3.1 Profile
7.3.2 Operation
7.3.3 Cobalt Business
7.3.4 Development Prospect
7.4 Shandong Jinling Mining
7.4.1 Profile
7.4.2 Operation
7.4.3 Cobalt Business
7.5 Chengdu Huaze Cobalt&nickel Material Co., Ltd
7.5.1 Profile
7.5.2 Operation
7.5.3 Cobalt Business
7.6 Beijing Easpring Material Technology
7.6.1 Profile
7.6.2 Operation
7.6.3 Cobalt Business
7.7 Hanrui Cobalt
7.7.1 Profile
7.7.2 Operation
7.7.3 Cobalt Business
7.8 Ramu Nico Management (Mcc) Limited
7.9 Jiangxi Rare Metal Tungsten Industry Holding Group Co., Ltd.
7.9.1 Profile
7.9.2 Jiangxi Jiangwu Cobalt Co., Ltd.
7.9.3 Jiangxi Jiangwu Nickel and Cobalt New Materials Co., Ltd.
7.9.4 Jiangxi Jiangwu International Nickel and Cobalt New Materials Co., Ltd.
7.10 Nantong Xinwei Nickel & Cobalt Hightech Development Co., Ltd.
Cobalt Production Process
Cobalt Product Process
Cobalt Industry Chain
Products of Major Cobalt Downstream Industries
Cobalt Reserves in Major Countries, 2016
Distribution of Global Associated Cobalt Mineral Resources
Output Distribution of Global Cobalt Mines
New Cobalt Mine Projects, 2017-2018
Global Cobalt Output and YoY Growth, 2005-2021E
Global Refined Cobalt Output and YoY Growth, 2005-2021E
Global Refined Cobalt Consumption, 2008-2017
Global Refined Cobalt Supply and Demand Balance Sheet, 2008-2016
Cobalt Demand Structure Worldwide, 2010-2017
Output of Cobalt in Major Countries, 2012-2016
Global Refined Cobalt Output Structure by Country, 2012-2016
Structure (%) of Global Cobalt Consumption by Country/Region, 2016
LME’s Spot Cobalt Price, 2015-2017
International Cobalt Price, 2014-2017
MB Cobalt Price, 2003-2017
MB Cobalt Price, 2016H2-Mar 2017
Price Rises of Global and China's Main Cobalt Products, by Mar 2017
Main Factors Affecting MB Cobalt Price, 2003-2017
Structure (%) of Global Refined Cobalt Output by Company, 2016
Global Refined Cobalt Output by Company, 2006-2016
Global Cobalt Raw Material Output by Enterprise / Mine, 2014-2015
Business Plans for In-service Cobalt Mines of Global Major Enterprises, 2017
Output and Expansion Plans of Global Major Refined Cobalt Enterprises
Global Refined Cobalt Supply and Demand Balance Sheet, 2016-2021
Cobalt Demand Structure in Worldwide, 2014-2021E
Policies on Cobalt Industry in China, 2011-2017
Cobalt Reserves Distribution in China (By Province)
China’s Cobalt Concentrate Output, 2005-2017
China’s Refined Cobalt Output, 2005-2017
China’s Refined Cobalt Consumption, 2006-2017
Cobalt Demand Structure in China, 2009-2017
Cobalt Price in China, 2014-2017
Cobalt Price, Jan-Mar 2017
Prices of Electrolytic Cobalt and Tricobalt Tetraoxide in China, 2016-2017
China’s Lithium Cobaltate Price, 2016-2017
China’s Refined Cobalt Output by Product, 2011-2016
China’s Refined Cobalt Output Structure by Product, 2016
China’s Tricobalt Tetraoxide Output, 2012-2016
Global Cobalt Powder Supply and Demand, 2016-2020E
China’s Cobalt Powder Supply and Demand, 2016-2020E
Cobalt Production Capacity of Major Chinese Manufacturers, 2016
Revenue and Cobalt Business Revenue of Global and China’s Major Cobalt Producers, 2015-2016
Cobalt Demand Structure China, 2014-2021E
Import Volume and Import Value of Cobalt Ores and Concentrates in China, 2006 -2016
China’s Import Volume of Cobalt Ores and Concentrates by Country, 2015-2016
China’s Import Volume and Import Value of Cobaltosic Oxide, 2006 -2016
China’s Export Volume and Export Value of Cobaltosic Oxide, 2006 -2016
Structure (%) of China’s Export Volume of Cobaltosic Oxide by Country, 2016
China’s Import Volume and Import Value of Cobalt Chloride, 2006 -2016
China’s Export Volume and Export Value of Cobalt Chloride, 2006 -2016
Structure (%) of China’s Export Volume of Cobaltosic Oxide by Country, 2016
China’s Import Volume and Import Value of Cobalt Carbonate, 2006-2016
China’s Export Volume and Export Value of Cobalt Carbonate, 2006-2016
Structure (%) of China’s Export Volume of Cobalt Carbonate by Country, 2016
China’s Import Volume and Import Value of Cobalt Nitrate, 2006 -2015
China’s Export Volume and Export Value of Cobalt Nitrate, 2006 -2016
Structure (%) of China’s Export Volume of Cobalt Nitrate by Country, 2015-2016
China’s Export Volume and Export Value of Cobalt Oxalate, 2006 -2016
Cobalt Application Structure, 2016
Global Power Lithium Battery Market Size, 2015-2021E
Small Lithium Cobalt Demand Structure of Global 3C Digital Consumer Goods, 2016
China’s Lithium Battery Output, 2011-2016
Lithium Battery Demand Structure China, 2016-2020E
Global Shipment of Cathode Materials (LFP/NCM/LCO/LMO/NCA), 2012-2020E
Consumption Structure of Lithium Battery Cathode Materials Worldwide, 2016
Global Shipments of Ternary Cathode Materials, 2009-2020E
Shares (%) of Cathode Materials (LFP, LCO, LMO, NCM) (for Electric Vehicle), 2020E
Shares (%) of Cathode Materials (LFP, LCO, LMO, NCM) (for 3C Consumer Electronics), 2020E
Shipment Percentages of Cathode Materials (NCM/LCO/LFP/LMO) in China, 2015-2016
Ternary Cathode Material (NCM) Shipment in China, 2011-2015
Shipment of Ternary Cathode Materials (NCM/NCA) in China, 2015-2020E
Market Size of Ternary Cathode Materials in China, 2013-2020E
Amount of Cobalt Consumed by Different Ternary Cathode Materials
Cobalt Demand Structure in Battery Industry
Metal Demand from Different Cathode Materials (Per Ton)
Global Battery-use Cobalt Demand, 2011-2021E
China’s Battery Materials-use Cobalt Demand, 2008-2021E
China’s Hard Alloy Output, 2009-2021E
Global Hard Alloy-use Cobalt Demand, 2012-2021E
China’s Hard Alloy-use Cobalt Demand, 2010-2021E
Classification of Magnetic Materials
Global Rare Earth Permanent Magnet Output and Growth Rate, 2008-2021E
Global Rare Earth Permanent Magnet Output Structure by Country, 2016
China’s Rare Earth Permanent Magnet Output and Growth Rate, 2006-2021E
Global Consumption of Magnetic Materials and Cobalt Demand by Application, 2015-2021E
China’s Magnetic Materials-use Cobalt Demand, 2009-2021E
Main Applications of Superalloy
Global Superalloy Consumption Structure by Application
Application of Superalloy in Aerospace Engine Thermal End Bearing Parts
Main Structure of Aerospace Engine
Superalloy Development Course in China
China’s Superalloy Output, 2004-2015
China’s High-end Superalloy Demand, 2009-2018E
Global Superalloy-use Cobalt Demand, 2012-2021E
China’s Superalloy-use Cobalt Demand, 2009-2021E
Distribution of Umicore’s Factories, 2016
Revenue and Net income of Umicore, 2008-2016
Revenue of Umicore by Business, 2011-2016
Revenue of Umicore by Business, 2015-2016
Split of Umicore Business Group, 2016
Profile of Energy & Surface Technologies Business Group
Growth and Profitability Drivers of Energy & Surface Technologies Business Group
Total Revenue Structure (%) of Umicore by Region, 2012-2016
R&D Costs and % of Total Revenue of Umicore, 2006-2016
Revenue and Profit from Energy & Surface Technologies Business of Umicore, 2012-2016
Output and YoY Growth of Refined Cobalt of Umicore, 2001-2016
Umicore’s Subsidiaries in China, by the End of 2016
Status Quo of Umicore’s Business in China
Outlook of Umicore, 2017
Fact of Glencore
Financial Highlights of Glencore, 2016
Revenue and Net income of Glencore Xstrata, 2012-2016
Revenue Structure (%) of Glencore Xstrata by Business, 2015-2016
Revenue Structure (%) of Glencore Xstrata by Region, 2014-2016
Cobalt Output of Glencore Xstrata by Mine Area, 2013-2016
Principal Subsidiaries engaged in Cobalt Production of Glencore Xstrata
Global Presence of Vale
Revenue and Net Income of Vale, 2008-2016
Revenue Structure of Vale by Business, 2015-2016
Production Summary of Vale by Product, 2011-2015
Sales Volume of Vale by Product, 2011-2015
Revenue Structure of Vale by Region, 2016
Revenue Breakdown of Vale by Region, 2015-2016
Cobalt Output of Vale, 2014-2017
Cobalt Output of Vale by Mine Area, 2010-2016
Cobalt Product Sales Volume and Average Sales Price of Vale, 2013-2016
Vale’s Revenue from Cobalt Products, 2011-2016
Cobalt Ore Reserves and Grades of Vale, 2015-2016
Cobalt Ore Mines of Vale, 2016
Vale in China
Vale’s Revenue and YoY Growth in China, 2010-2016
Vale’s Annual Cash Break-Even Cost Landed in China for Iron Ore and Pellets, 2016
Mineral Distribution of Freeport
Highlight of Freeport, 2016
Revenue and Net income of Freeport, 2008-2016
Revenue Structure of Freeport by Product, 2014-2016
Revenue Breakdown of Freeport by Country/Region, 2010-2016
Sales of Freeport by Region, 2016
Cobalt Business Revenue and Gross Profit of Freeport, 2010-2016
Cobalt Output and Sales Volume and Average Price of Freeport, 2010-2016
Revenue and YoY Growth of Freeport in China, 2008-2016
Revenue and Net income of Shenzhen Green Eco-Manufacture, 2010-2016
Revenue of Shenzhen Green Eco-Manufacture by Product, 2014-2016
Revenue of Shenzhen Green Eco-Manufacture by Region, 2010-2016
Procurement from Top 5 Suppliers of Shenzhen Green Eco-Manufacture, 2013-2016
R&D Costs and % of Total Revenue of Shenzhen Green Eco-Manufacture, 2010-2016
Revenue from Cobalt and Related Products and Gross Margin of Shenzhen Green Eco-Manufacture, 2014-2016
Cobalt Output, Sales Volume and Average Price of Shenzhen Green Eco-Manufacture by Product, 2013-2016
Reserves and Grades of Mines with Mining Rights of Huayou Cobalt
Revenue and Net income of Huayou Cobalt, 2010-2016
Revenue and Net income of Huayou Cobalt’s Main Subsidiaries, 2015-2016
Operating Revenue of Huayou Cobalt by Product, 2014-2016
Operating Revenue of Huayou Cobalt by Region, 2012-2016
Gross Margin of Huayou Cobalt by Product, 2014-2016
Major Customers of Huayou Cobalt
Production and Sales Volume of Huayou Cobalt, 2015-2016
Cobalt Volume and Market Share of Huayou Cobalt, 2011-2015
Cobalt Product Cost Structure of Huayou Cobalt, 2014-2016
Main Projects under Construction of Huayou Cobalt, 2017
Revenue and Net income of Jinchuan Group, 2009-2017
Revenue and Proportion of Jinchuan Group by Product, 2013-2016
Gross Margin of Jinchuan Group by Business, 2012-2016
Cobalt Metal Production and Sales of Jinchuan Group, 2010-2016
Cobalt Product Revenue of Jinchuan Group, 2010-2016
Revenue and Net income of Shandong Jinling Mining, 2007-2016
Revenue Structure of Shandong Jinling Mining by Product, 2012-2016
Revenue of Shandong Jinling Mining by Region, 2008-2016
Gross Margin of Shandong Jinling Mining by Product, 2008-2016
Cobalt Production and Sales and Sales-Output Ratio of Shandong Jinling Mining, 2009-2016
Revenue from Cobalt Concentrate Powder of Shandong Jinling Mining, 2008-2016
Revenue and Net income of Shaanxi Huaze Nickel & Cobalt Metal, 2013-2016
Operating Revenue and Structure of Shaanxi Huaze Nickel & Cobalt Metal by Product, 2014-2016
Operating Revenue and Structure of Shaanxi Huaze Nickel & Cobalt Metal by Region, 2014-2016
Gross Margin of Shaanxi Huaze Nickel & Cobalt Metal by Product, 2015-2016
Cobalt Chloride Output and Sales Volume of Shaanxi Huaze Nickel & Cobalt Metal, 2013-2016
Joint-stock and Shareholding Companies of Beijing Easpring Material Technology
Development Course of Beijing Easpring Material Technology, 1992-2017
Revenue and Net Income of Beijing Easpring Material, 2007-2016
Revenue of Beijing Easpring Material by Business, 2010-2016
Revenue of Beijing Easpring Material by Region, 2008-2016
Gross Margin of Beijing Easpring Material by Business, 2015-2016
Sales Volume of Ternary Cathode Materials of Beijing Easpring Material Technology, 2011-2016
Main Products and Major Manufacturers of Hanrui Cobalt, 2016
Revenue and Net income of Hanrui Cobalt, 2014-2016
Revenue Breakdown of Hanrui Cobalt by Product, 2014-2016
Gross Margin of Hanrui Cobalt by Product, 2014-2016
Output of Hanrui Cobalt by Product, 2014-2016
Cobalt Powder Market Share and Export Share of Hanrui Cobalt in China, 2013-2015
Copper Cobalt Ore Procurement of Congo METM under Hanrui Cobalt
Output and Sales Volume of Congo METM under Hanrui Cobalt by Product, 2014-2016
Shareholding Structure of Projects of Ramu Nico Management Limited
Nickel Cobalt Companies of Jiangxi Rare Metal Tungsten Industry Holding Group
Global and China Rare Earth Permanent Magnet Industry Report, 2018-2023
Rare earth permanent magnets consist of SmCo permanent magnet and NdFeB permanent magnet among which NdFeB as a kind of 3rd-Gen rare earth permanent magnetic material takes a lion’s share of the marke...
Global and China NdFeB Industry Report, 2018-2023
Featured with strong magnetic energy product and high compacted density, NdFeB is widely used in various fields. The NdFeB industry over the recent years has characterized the following:
First, the N...
Global and China Vanadium Industry Report, 2018-2023
Vanadium, deemed as the “vitamin” of metals, finds wide application in steel, chemicals, new materials and new energy. There is now global research and development of vanadium for applying it to more ...
Global and China Cobalt Industry Report, 2018-2023
Cobalt, an essential raw material for lithium battery, is widely used in electric vehicles as well as computer, communication and consumer electronics. 59% of cobalt was used in lithium battery global...
Global and China Nickel Industry Report, 2017-2020
Global primary nickel output in 2016 fell 1.5% to 1.934 million tons. In 2017, as China’s nickel pig iron project in Indonesia reaches design capacity gradually, nickel metal supply is expected to hit...
Global and China Cobalt Industry Report, 2017-2021
In recent years, the global refined cobalt market has been in a state of oversupply, but the inventory has been decreasing year by year. In 2016, the global refined cobalt output and consumption were ...
China Silicon Carbide Industry Report, 2016-2020
China is the largest producer and exporter of silicon carbide in the world, with the capacity reaching 2.2 million tons, sweeping more than 80% of the global total. However, excessive capacity expansi...
China Antimony Industry Report, 2016-2020
According to USGS, global antimony reserves totaled 2 million tons and antimony ore production 150,000 tons in 2015. In China, the reserves of antimony stood at 950,000 tons and antimony ore productio...
Global and China Cobalt Industry Report, 2016-2020
Cobalt is an important strategic metal used in lithium battery manufacturing, hard alloy smelting and superalloy production, mainly available in Congo, Australia, Cuba and other countries.
In 2015, t...
China Silicon Carbide Industry Report, 2015-2019
China is the largest producer and exporter of silicon carbide in the world, with the capacity reaching 2.2 million tons, accounting for more than 80% of the global total. In 2014, the total silicon ca...
Global and China Antimony Industry Report, 2015
Since 2015, China’s antimony industry has been characterized by the followings:
China sees a continued decline in the output of antimony concentrates and antimony products. Owing to weak demand from ...
Global and China Bi-Metal Band Saw Blade Industry Report, 2015-2018
Since the year 2012, due to the aftermath of the global financial crisis and the sub-prime crisis, the prosperity index of manufacturing in China has continued to decline, and the machine tool industr...
Global and China Aluminum Alloy Automotive Sheet Industry Report, 2014-2017
In recent years, driven by energy conservation and emissions reduction and improvement of fuel efficiency, auto industry has been required to develop towards an increasingly lightweight trend. A great...
China Rare Earth Industry Report, 2014-2018
Rare earth, also known as rare earth metal or rare earth element, collectively refers to lanthanides (including fifteen elements) and closely-related scandium and yttrium. As a crucial strategic resou...
China Silicon Carbide Industry Report, 2014-2017
As a major producer and exporter of silicon carbide, China contributes about 80% to the global silicon carbide capacity. In 2013, China exported 286,800 tons of silicon carbide after the abolition of ...
China Antimony Industry Report, 2014-2017
Since 2014, China’s antimony industry has been characterized by the following:
First, China holds a stable position as a major antimony producer. According to the statistics by USGS, in 2013, up...
Global and China Vanadium Industry Report, 2014-2017
The world’s recoverable vanadium reserves so far has been recorded at 14 million tons, mainly found in China, Russia, South Africa and other countries. In 2013, roughly 151,000 tons of vanadium (V2O5 ...
Global and China Silica(White Carbon Black) Industry Report, 2014-2017
China, the world’s largest silica producer, had silica capacity of 2.20 million tons in 2013, slowing to a year-on-year increase of 8.1% and accounting for 60% of global capacity, of which 2.079 milli...