Global and China Cobalt Industry Report, 2018-2023
-
Oct.2018
- Hard Copy
- USD
$3,200
-
- Pages:150
- Single User License
(PDF Unprintable)
- USD
$3,000
-
- Code:
BXM116
- Enterprise-wide License
(PDF Printable & Editable)
- USD
$4,500
-
- Hard Copy + Single User License
- USD
$3,400
-
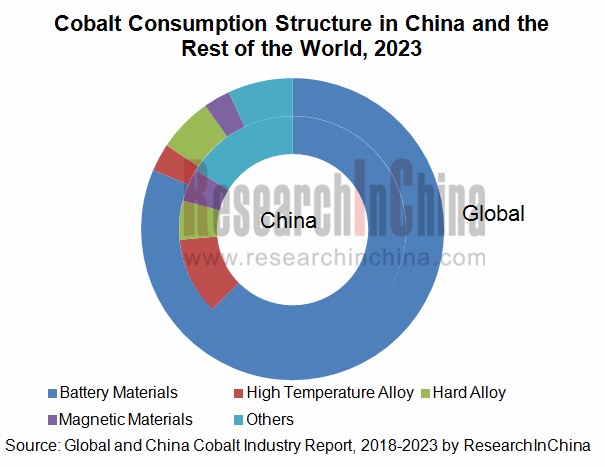
Cobalt, an essential raw material for lithium battery, is widely used in electric vehicles as well as computer, communication and consumer electronics. 59% of cobalt was used in lithium battery globally and even up to 77.4% in China in 2017. The cobalt for the battery will see a rising proportion in future, expected to surpass 62% globally and 81% in China in 2023.
Due to an upsurge in the demand from downstream sectors like smartphone and electric vehicle (EV), global cobalt prices has been on the rise since 2016, doubling in 2017 and peaking at USD43.7/pound in late April 2018. Despite a decline in the second quarter of 2018, the cobalt prices are more likely to climb in the future, as the demand remains strong while the supply is limited.
Cobalt metal is derived from cobalt ore and refined cobalt. Nearly 60% of cobalt ore is contributed by Democratic Republic of the Congo, a country that promulgated new mining law in March 2018 in which cobalt is classified as strategic metal and windfall profits tax and royalties are planned to be imposed on enterprises. The measures will affect the global supply of cobalt and the price trend.
Nearly 98% of cobalt needs to be imported in China. Chinese enterprises invest in cobalt mines and participate in cobalt smelting projects in Democratic Republic of the Congo so as to obtain stable cobalt resources. For example, China Molybdenum now is the world’s second largest cobalt ore producer, only second to Glencore, by acquiring Freeport cobalt ore resources.
China is a major cobalt smelting country in the world with refined cobalt output of 70kt in 2017, 59.5% of the global total, nearly 80kt in 2018 and estimated over 110kt in 2023. At the same time, the country’s cobalt consumption will increase from 59kt in 2017 to around 98kt in 2023.
Global and China Cobalt Industry Report, 2018-2023 highlights the following:
 Cobalt ore resources distribution, cobalt ore production & smelting, cobalt consumption & structure, price trend, corporate competition, and development trends worldwide;
Cobalt ore resources distribution, cobalt ore production & smelting, cobalt consumption & structure, price trend, product mix, corporate competition, and development trends in China;
Import and export of main cobalt products (cobalt concentrate, cobalt chloride, cobalt carbonate, cobalt nitrate, and cobalt oxalate) in China;
Status quo of and demand for cobalt from the downstream industries (battery, hard alloy, high-temperature alloy, rare-earth permanent magnet);
Five global and fourteen cobalt producers (operation, cobalt business, development strategy, etc.)
1. Cobalt Overview
1.1 Definition
1.2 Industry Chain
2. Status Quo of Global Cobalt Market
2.1 Cobalt Ore Reserves
2.2 Market Supply
2.2.1 Production of Cobalt Ores
2.2.2 Cobalt Recycling
2.2.3 Cobalt Smelting
2.3 Demand
2.4 Price
2.5 Competition Pattern
2.5.1 Cobalt Ore Enterprises
2.5.2 Refined Cobalt Enterprises
2.6 Development Trend
3. Cobalt Market Development in China
3.1 Overview
3.2 Policy
3.3 Cobalt Ore Resources
3.4 Market Supply and Demand
3.4.1 Supply
3.4.2 Demand
3.4.3 Structure of Supply and Demand
3.5 Price
3.6 Product Structure
3.7 Competition Pattern
3.8 Development Trend
4. China’s Import and Export of Cobalt by Product
4.1 Cobalt Ores and Concentrates
4.1.1 Import
4.1.2 Regional Structure
4.2 Cobaltosic Oxide
4.2.1 Import
4.2.2 Export
4.3 Cobalt Chloride
4.3.1 Import and Export
4.3.2 Regional Structure
4.4 Cobalt Carbonate
4.4.1 Import and Export
4.4.2 Regional Structure
4.5 Cobalt Nitrate
4.5.1 Import and Export
4.5.2 Regional Structure
4.6 Cobalt Oxalate
5. Demand of Main Cobalt Downstream Industries
5.1 Battery Materials
5.1.1 Market Development
5.1.2 Demand for Cobalt
5.2 Hard Alloy
5.2.1 Market Development
5.2.2 Demand for Cobalt
5.3 Magnetic Materials
5.3.1 Market Development
5.3.2 Demand for Cobalt
5.4 Superalloy
5.4.1 Market Development
5.4.2 Demand for Cobalt
6. Major Global Cobalt Manufacturers
6.1 Umicore
6.1.1 Profile
6.1.2 Operation
6.1.3 Cobalt Business (Cobalt Specialty Materials)
6.1.4 Business in China
6.1.5 Development Prospect
6.2 Glencore Xstrata
6.2.1 Profile
6.2.2 Operation
6.2.3 Cobalt Business
6.3 Vale
6.3.1 Profile
6.3.2 Operation
6.3.3 Cobalt Business
6.3.4 Business in China
6.4 Freeport
6.4.1 Profile
6.4.2 Operation
6.4.3 Cobalt Business
6.4.4 Business in China
6.5 Sherritt International
6.5.1 Profile
6.5.2 Operation
6.5.3 Cobalt Business
7. Major Chinese Cobalt Producers
7.1 Shenzhen Green Eco-manufacture Hi-tech
7.1.1 Profile
7.1.2 Operation
7.1.3 Cobalt Business
7.1.4 Development Prospect
7.2 Huayou Cobalt
7.2.1 Profile
7.2.2 Operation
7.2.3 Cobalt Business
7.2.4 Development Strategy
7.3 Jinchuan Group Co., Ltd.
7.3.1 Profile
7.3.2 Operation
7.3.3 Cobalt Business
7.3.4 Development Strategy
7.4 Shandong Jinling Mining
7.4.1 Profile
7.4.2 Operation
7.4.3 Cobalt Business
7.5 Beijing Easpring Material Technology
7.5.1 Profile
7.5.2 Operation
7.5.3 Cobalt Business
7.6 Hanrui Cobalt
7.6.1 Profile
7.6.2 Operation
7.6.3 Cobalt Business
7.6.4 Development Strategy
7.7 China Molybdenum Co., Ltd.
7.7.1 Profile
7.7.2 Operation
7.7.3 Cobalt Business
7.8 Guangdong Silver
7.8.1 Profile
7.8.2 Operation
7.8.3 Cobalt Business
7.9 Ganzhou Tengyun Cobalt New Material Co.,Ltd
7.9.1 Profile
7.9.2 Operation
7.9.3 Cobalt Business
7.10 Ramu Nico Management (Mcc) Limited
7.10.1 Profile
7.10.2 Operation
7.11 Jiangxi Rare Metal Tungsten Industry Holding Group Co., Ltd.
7.11.1 Profile
7.11.2 Jiangxi Jiangwu Cobalt Co., Ltd.
7.11.3 Jiangxi Jiangwu Nickel and Cobalt New Materials Co., Ltd.
7.11.4 Jiangxi Jiangwu International Nickel and Cobalt New Materials Co., Ltd.
7.12 Nantong Xinwei Nickel & Cobalt Hightech Development Co., Ltd.
7.12.1 Profile
7.12.2 Operation
7.13 Guangdong Jiana Energy Technology Co., Ltd.
7.13.1 Profile
7.13.2 Operation
7.13.3 Cobalt Business
7.14 Tianjin Maolian Technology Co.,Ltd
7.14.1 Profile
7.14.2 Cobalt Business
Cobalt Production Process
Cobalt Product Process
Cobalt Industry Chain
Products of Major Cobalt Downstream Industries
Cobalt Reserves in Major Countries, 2017
Cobalt Output in Democratic Republic of the Congo, 2015-2018
Global Cobalt Resources by Form
Global Cobalt Reserves by Company, 2017
Cobalt Reserves of Glencore
Global Cobalt Ore Output by Country, 2016-2017
Cobalt Mine Capacity to be Newly Constructed or Resumed Worldwide
Output Growth of Main Cobalt Mines Worldwide, 2018-2020E
Quarterly Cobalt Output of Glencore, 2016-2018
Recycling Period and Rate of Cobalt Products
Global Refined Cobalt Output, 2011-2018
Global Cobalt Consumption, 2010-2017
Cobalt Demand Structure Worldwide, 2017
Global Cobalt Price, 1989-2017
Global MB Cobalt Price, 2016-2018
Changes in Global Cobalt Inventory by Region, 2011-2018
Changes in Global Cobalt Inventory and Price, 2013-2018
Supply of Main Cobalt Ore Companies Worldwide, 2017-2018
Output of Refined Cobalt Companies Worldwide, 2011-2017
Global Cobalt Supply and Demand Structure, 2011-2023E
Cobalt Demand Structure in Worldwide, 2016-2023E
Chinese Companies’ Layout of Cobalt Industry Chain
Policies on Cobalt Industry in China, 2011-2018
Cobalt Reserves Distribution in China (By Province)
Cobalt Mines Invested by Chinese Companies in Democratic Republic of the Congo
Cobalt Mines Invested by Chinese Companies in Australia and Other Places
China’s Refined Cobalt Output, 2008-2018
Sources of China’s Refined Cobalt Raw Materials, 2015-2017
Capacity Expansion of Main Cobalt Smelting Companies in China, Since 2017
China’s Refined Cobalt Consumption, 2008-2018
Cobalt Demand Structure in China, 2017
Supply and Demand Balance in Chinese Cobalt Market, 2011-2017
Cobalt Price Trend in China, 2010-2018
Cobalt Price by Product in China, 2016-2018
Cobalt Prices at Home and Abroad, 2016-2018
China’s Refined Cobalt Output by Product, 2015-2017
Output of Main Refined Cobalt Companies in China, 2015-2017
Revenue and Gross Margin of China’s Major Cobalt Producers, 2017
China’s Refined Cobalt Output, 2017-2023E
China’s Refined Cobalt Consumption, 2017-2023E
Cobalt Demand Structure China, 2016-2023E
Import Volume and Import Value of Cobalt Ores and Concentrates in China, 2008 -2017
China’s Import Volume of Cobalt Ores and Concentrates by Country, 2015-2016
China’s Export Volume and Export Value of Cobaltosic Oxide, 2006 -2017
China’s Import Volume and Import Value of Cobalt Chloride, 2006 -2016
China’s Export Volume and Export Value of Cobalt Chloride, 2006 -2016
Structure (%) of China’s Export Volume of Cobaltosic Oxide by Country, 2016
China’s Import Volume and Import Value of Cobalt Carbonate, 2006-2016
China’s Export Volume and Export Value of Cobalt Carbonate, 2006-2016
Structure (%) of China’s Export Volume of Cobalt Carbonate by Country, 2016
China’s Import Volume and Import Value of Cobalt Nitrate, 2006 -2015
China’s Export Volume and Export Value of Cobalt Nitrate, 2006 -2016
Structure (%) of China’s Export Volume of Cobalt Nitrate by Country, 2015-2016
China’s Export Volume and Export Value of Cobalt Oxalate, 2006 -2016
Global Lithium Battery Shipments by Type, 2011-2017
Small Lithium Cobalt Demand Structure of Global 3C Digital Consumer Goods, 2016
China’s Lithium Battery Shipments by Type, 2011-2017
Global TOP10 Power Lithium Battery Companies by Shipment/Market Share, 2017
China’s Lithium Battery Cathode Material Sales, 2011-2017
Competitive Pattern of Chinese Lithium Battery Cathode Material Market, 2017
Capacity of Main Ternary Precursor Companies in China, 2017-2018
Capacity of Main Ternary Material and Lithium Cobalt Oxide Companies in China, 2017-2018
Amount of Cobalt Consumed by Different Ternary Cathode Materials
Cobalt Demand Structure in Battery Industry
Metal Demand from Different Cathode Materials (Per Ton)
Demand for Cobalt from New Energy Vehicles
Demand for Cobalt from Battery Industry in China, 2016-2023E
Battery Cobalt Demand Structure in China, 2017-2023E
Global Demand for Cobalt from Battery Industry, 2016-2023E
Classification of Hard Alloy (by Component)
Global Hard Alloy Output, 2011-2017
Global Hard Alloy Output Distribution by Region, 2017
China’s Hard Alloy Output, 2011-2023E
Output and Market Share of Key Hard Alloy Companies in China, 2017
China’s Hard Alloy-use Cobalt Demand, 2011-2023E
Classification of Magnetic Materials
Global Rare Earth Permanent Magnet Output and Growth Rate, 2011-2023E
China’s Rare Earth Permanent Magnet Output and Growth Rate, 2010-2023E
Global Magnetic Materials-use Cobalt Demand, 2017-2023E
China’s Magnetic Materials-use Cobalt Demand, 2016-2023E
Main Applications of Superalloy
Global Superalloy Consumption Structure by Application
Application of Superalloy in Aerospace Engine Thermal End Bearing Parts
Main Structure of Aerospace Engine
Superalloy Development Course in China
China’s Superalloy Output, 2012-2020E
Global Superalloy-use Cobalt Demand, 2012-2023E
China’s Superalloy-use Cobalt Demand, 2009-2023E
Distribution of Umicore’s Factories, 2017
Revenue and Net income of Umicore, 2008-2018
Revenue of Umicore by Business, 2011-2018
Energy & Surface Technologies Business Group Profile
Growth and Profitability Drivers of Energy & Surface Technologies Business Group
Total Revenue Structure (%) of Umicore by Region, 2012-2017
R&D Costs and % of Total Revenue of Umicore, 2008-2018
Revenue and Profit from Energy & Surface Technologies Business of Umicore, 2013-2018
Output and YoY Growth of Refined Cobalt of Umicore, 2001-2016
Umicore’s Subsidiaries in China, by the End of 2017
Status Quo of Umicore’s Business in China
Outlook of Umicore, 2018
Glencore Fact
Financial Highlights of Glencore, 2017
Revenue and Net income of Glencore Xstrata, 2012-2018
Revenue Structure (%) of Glencore Xstrata by Business, 2015-2018
Revenue Structure (%) of Glencore Xstrata by region, 2014-2017
Cobalt Output of Glencore Xstrata by Mine Area, 2013-2018
Principal Subsidiaries engaged in Cobalt Production of Glencore Xstrata
Global Presence of Vale
Revenue and Net Income of VALE, 2009-2018
Revenue Structure of VALE by Business, 2016-2018
Revenue Structure of VALE by Region, 2017
Revenue Breakdown of Vale by Region, 2016-2018
Cobalt Output of Vale, 2015-2018
Cobalt Output of Vale by Mine Area, 2010-2018
Cobalt Product Sales Volume and Revenue of Vale, 2013-2018
Cobalt Ore Reserves and Grades of Vale, 2016-2017
Cobalt Ore Mines of Vale, 2017
Vale in China
Vale’s Revenue and YoY Growth in China, 2010-2018
Vale’s Annual Cash Break-Even Cost Landed in China for Iron Ore and Pellets, 2016-2018
Mineral Distribution of Freeport
Highlight of Freeport, 2017
Revenue and Net income of Freeport, 2008-2018
Revenue Structure of Freeport by Product, 2015-2017
Revenue Breakdown of Freeport by Country/Region, 2015-2017
Sales of Freeport by Region, 2017
Cobalt Business Revenue and Gross Profit of Freeport, 2010-2016
Cobalt Output and Sales Volume and Average Price of Freeport, 2010-2016
Revenue and YoY Growth of Freeport in China, 2008-2017
Sherritt’s Main Subsidiaries
Sherritt’s Key Operational Indicators, 2016-2017
Sherritt’s Development Strategy, 2018
Sherritt’s Cobalt Output and Sales, 2016-2017
Sherritt’s Cobalt Output by Source, 2015-2017
Sherritt’s Cobalt Sales, 2016-2017
Revenue and Net income of Shenzhen Green Eco-Manufacture, 2010-2018
Revenue of Shenzhen Green Eco-Manufacture by Product, 2017-2018
Revenue of Shenzhen Green Eco-Manufacture by Region, 2010-2018
Procurement from Top 5 Suppliers of Shenzhen Green Eco-Manufacture, 2013-2017
R&D Costs and % of Total Revenue of Shenzhen Green Eco-Manufacture, 2010-2018
Production Capacity of Shenzhen Green Eco-Manufacture by Product, by June 2018
Cobalt Industry Recycling Production Mode of Shenzhen Green Eco-Manufacture
Downstream Customers for Cobalt Lithium Battery Materials of Shenzhen Green Eco-Manufacture
Production Capacity, Sales Volume and Revenue of Shenzhen Green Eco-Manufacture by Product, 2015-2020E
Production Capacity and Sales Volume of Battery Materials of Shenzhen Green Eco-Manufacture, 2015-2020E
Revenue and Net income of Huayou Cobalt, 2010-2018
Revenue and Net income of Huayou Cobalt’s Main Subsidiaries, 2015-2017
Operating Revenue of Huayou Cobalt by Product, 2014-2018
Operating Revenue of Huayou Cobalt by Region, 2012-2017
Gross Margin of Huayou Cobalt by Product, 2014-2018
Major Customers of Huayou Cobalt
Production and Sales Volume of Cobalt Products of Huayou Cobalt, 2016-2018
Cobalt Product Cost Structure of Huayou Cobalt, 2015-2017
Revenue and Net income of Jinchuan Group, 2009-2018
Revenue and Proportion of Jinchuan Group by Product, 2014-2017
Gross Margin of Jinchuan Group by Product, 2014-2017
Cobalt Production Capacity of Jinchuan Group, 2015-2018
Concentrates Output of Jinchuan Group, 2015-2018
Sources of Cobalt Raw Materials Purchased by Jinchuan Group, 2015-2018
Jinchuan Group’s Procurement of Cobalt Raw Materials from Its Top 5 Suppliers, 2017
Key Operational Indicators of Jinchuan Technology, 2016-2017
Electrolytic Cobalt Production and Sales of Jinchuan Group, 2010-2018
Cobalt Product Revenue of Jinchuan Group, 2010-2017
Jinchuan Group’s Revenue from Top 5 Cobalt Product Customers, 2017
Proposed Project of Jinchuan Group, 2018
Revenue and Net income of Shandong Jinling Mining, 2007-2018
Revenue Structure of Shandong Jinling Mining by Product, 2012-2018
Revenue of Shandong Jinling Mining by Region, 2008-2018
Gross Margin of Shandong Jinling Mining by Product, 2008-2018
Cobalt Production and Sales and Sales-Output Ratio of Shandong Jinling Mining, 2009-2017
Revenue from Cobalt Concentrate Powder of Shandong Jinling Mining, 2008-2018
Joint-stock and Shareholding Companies of Beijing Easpring Material Technology
Development Course of Beijing Easpring Material Technology, 1992-2017
Revenue and Net Income of Beijing Easpring Material, 2007-2018
Revenue of Beijing Easpring Material by Business, 2010-2018
Revenue of Beijing Easpring Material by Region, 2008-2018
Gross Margin of Beijing Easpring Material by Quarter, 2008-2018H1
Gross Margin of Beijing Easpring Material by Business, 2015-2018
Key Lithium Battery Materials of Beijing Easpring Material
Development History of Lithium Battery Cathode Materials of Beijing Easpring Material
Mineral Resources of Syerston
Key Projects of Beijing Easpring Material in Recent Years
Capacity and Sales Volume of Cathode Materials of Beijing Easpring Material, 2015-2020E
Revenue and Net income of Hanrui Cobalt, 2014-2018
Revenue Breakdown of Hanrui Cobalt by Product, 2014-2018
Gross Margin of Hanrui Cobalt by Product, 2014-2018
Output of Hanrui Cobalt by Product, 2014-2017
Capacity of Major Products and Capacity Planning of Hanrui Cobalt, 2017
Output of Hanrui Cobalt by Product, 2016-2020E
Cobalt Powder Market Share and Export Share of Hanrui Cobalt in China, 2013-2015
Capacity Planning of Hanrui Cobalt
Revenue and Net income of China Molybdenum, 2014-2018
Revenue and Gross Margin of China Molybdenum by Product, 2016-2018
Revenue and Gross Margin of China Molybdenum by Region, 2016-2018
Cobalt Metal Sales Volume of China Molybdenum’s Tenke Mine, 2017-2020E
Revenue of China Molybdenum’s Tenke Mine, 2017-2020E
Revenue and Net income of Guangdong Silver, 2014-2018
Operating Revenue and Gross Margin of Guangdong Silver by Product, 2017-2018
Proposed Cobalt Project of Guangdong Silver, 2018
Revenue and Net income of Ganzhou Tengyuan Cobalt New Material, 2014-2017
Capacity and Output of Ganzhou Tengyuan Cobalt New Material, 2014-2017
Proposed Project of Ganzhou Tengyuan Cobalt New Material, 2018
Shareholding Structure of Projects of Ramu Nico Management Limited, 2017
Nickel Cobalt Companies of Jiangxi Rare Metal Tungsten Industry Holding Group
Major Subsidiaries of Guangdong Jiana Energy Technology
Revenue and Net Income of Guangdong Jiana Energy Technology, 2016-2018
Revenue of Guangdong Jiana Energy Technology by Region, 2016-2018
Production Capacity and Sales Volume of Guangdong Jiana Energy Technology by Product, 2016-2018
Revenue Structure (%) and Gross Margin of Guangdong Jiana Energy Technology by Product, 2016-2018
Revenue, Sales Volume and Gross Margin of Guangdong Jiana Energy Technology by Product, 2016-2018
Global and China Rare Earth Permanent Magnet Industry Report, 2018-2023
Rare earth permanent magnets consist of SmCo permanent magnet and NdFeB permanent magnet among which NdFeB as a kind of 3rd-Gen rare earth permanent magnetic material takes a lion’s share of the marke...
Global and China NdFeB Industry Report, 2018-2023
Featured with strong magnetic energy product and high compacted density, NdFeB is widely used in various fields. The NdFeB industry over the recent years has characterized the following:
First, the N...
Global and China Vanadium Industry Report, 2018-2023
Vanadium, deemed as the “vitamin” of metals, finds wide application in steel, chemicals, new materials and new energy. There is now global research and development of vanadium for applying it to more ...
Global and China Cobalt Industry Report, 2018-2023
Cobalt, an essential raw material for lithium battery, is widely used in electric vehicles as well as computer, communication and consumer electronics. 59% of cobalt was used in lithium battery global...
Global and China Nickel Industry Report, 2017-2020
Global primary nickel output in 2016 fell 1.5% to 1.934 million tons. In 2017, as China’s nickel pig iron project in Indonesia reaches design capacity gradually, nickel metal supply is expected to hit...
Global and China Cobalt Industry Report, 2017-2021
In recent years, the global refined cobalt market has been in a state of oversupply, but the inventory has been decreasing year by year. In 2016, the global refined cobalt output and consumption were ...
China Silicon Carbide Industry Report, 2016-2020
China is the largest producer and exporter of silicon carbide in the world, with the capacity reaching 2.2 million tons, sweeping more than 80% of the global total. However, excessive capacity expansi...
China Antimony Industry Report, 2016-2020
According to USGS, global antimony reserves totaled 2 million tons and antimony ore production 150,000 tons in 2015. In China, the reserves of antimony stood at 950,000 tons and antimony ore productio...
Global and China Cobalt Industry Report, 2016-2020
Cobalt is an important strategic metal used in lithium battery manufacturing, hard alloy smelting and superalloy production, mainly available in Congo, Australia, Cuba and other countries.
In 2015, t...
China Silicon Carbide Industry Report, 2015-2019
China is the largest producer and exporter of silicon carbide in the world, with the capacity reaching 2.2 million tons, accounting for more than 80% of the global total. In 2014, the total silicon ca...
Global and China Antimony Industry Report, 2015
Since 2015, China’s antimony industry has been characterized by the followings:
China sees a continued decline in the output of antimony concentrates and antimony products. Owing to weak demand from ...
Global and China Bi-Metal Band Saw Blade Industry Report, 2015-2018
Since the year 2012, due to the aftermath of the global financial crisis and the sub-prime crisis, the prosperity index of manufacturing in China has continued to decline, and the machine tool industr...
Global and China Aluminum Alloy Automotive Sheet Industry Report, 2014-2017
In recent years, driven by energy conservation and emissions reduction and improvement of fuel efficiency, auto industry has been required to develop towards an increasingly lightweight trend. A great...
China Rare Earth Industry Report, 2014-2018
Rare earth, also known as rare earth metal or rare earth element, collectively refers to lanthanides (including fifteen elements) and closely-related scandium and yttrium. As a crucial strategic resou...
China Silicon Carbide Industry Report, 2014-2017
As a major producer and exporter of silicon carbide, China contributes about 80% to the global silicon carbide capacity. In 2013, China exported 286,800 tons of silicon carbide after the abolition of ...
China Antimony Industry Report, 2014-2017
Since 2014, China’s antimony industry has been characterized by the following:
First, China holds a stable position as a major antimony producer. According to the statistics by USGS, in 2013, up...
Global and China Vanadium Industry Report, 2014-2017
The world’s recoverable vanadium reserves so far has been recorded at 14 million tons, mainly found in China, Russia, South Africa and other countries. In 2013, roughly 151,000 tons of vanadium (V2O5 ...
Global and China Silica(White Carbon Black) Industry Report, 2014-2017
China, the world’s largest silica producer, had silica capacity of 2.20 million tons in 2013, slowing to a year-on-year increase of 8.1% and accounting for 60% of global capacity, of which 2.079 milli...