Global and China Nickel Industry Report, 2017-2020
-
Jun.2017
- Hard Copy
- USD
$2,600
-
- Pages:112
- Single User License
(PDF Unprintable)
- USD
$2,400
-
- Code:
LT034
- Enterprise-wide License
(PDF Printable & Editable)
- USD
$3,700
-
- Hard Copy + Single User License
- USD
$2,800
-
Global primary nickel output in 2016 fell 1.5% to 1.934 million tons. In 2017, as China’s nickel pig iron project in Indonesia reaches design capacity gradually, nickel metal supply is expected to hit 250 kilotons with an additional 150 kilotons, primarily owing to the rapid rise of Jiangsu Delong Nickel Industry’s project in Indonesia. Affected by this, global primary nickel output is expected to reverse the downward trend since 2014, with an expected output of 2.06 million tons, up 6.7%.
In 2016, global demand for refined nickel was 1.8791 million tons, down 2.64% year on year, indicating a supply shortage of 51.5 kilotons, the situation was still not optimistic. By country, main consumption areas such as China, Japan, the United States, Taiwan and South Korea reported consumption growth, especially consumption in S. Korea surged 36.7% year on year.
China with nickel ore reserves of 2.5 million tons occupies the tenth position in the world, but it has been importing nickel ores and refined nickel for a long time, especially the degree of import dependence on Philippine nickel ores remains above 70%. The Philippine government is now concentrating on cleaning up and reorganizing large nickel mines, which affects China's imports of Philippine nickel ores.
In 2016, China’s nickel ore production added up to 90 kilotons, down 10.71% year on year. Influenced by raw material constrictions and prices, Jinchuan Group plans output of 140-145 kilotons for 2017, a year-on-year decrease of 12 kilotons, while other enterprise in production show stable yield. At the current level of nickel prices, enterprises in discontinued production including Shaanxi Huaze Nickel & Cobalt Metal and Yunnan Tin Group Yuanjiang Nickel Industry have weak incentives to restore production. Nickel fundamentals were improved in 2016, resulting in a steady rebound in nickel prices under the expectation of a supply contraction. As the nickel supply-demand gap continues in 2017, nickel prices are expected to recover gradually, accompanied by RMB76,000-105,000/ton fluctuations and an average of approximately RMB90,000/ton in China this year.
Influenced by factors such as raw materials and environmental protection, China’s NPI capacity concentration has increased: there are more than 40 nickel-iron (RKEF, electric furnace, blast furnace) enterprises in production in China, a dive compared with more than 200 during the peak period since a lot of small nickel-iron enterprises have exited due to raw material supply, cost, environmental protection, etc. while some large, competitive enterprises became profitable and intensified expansion efforts in 2016.
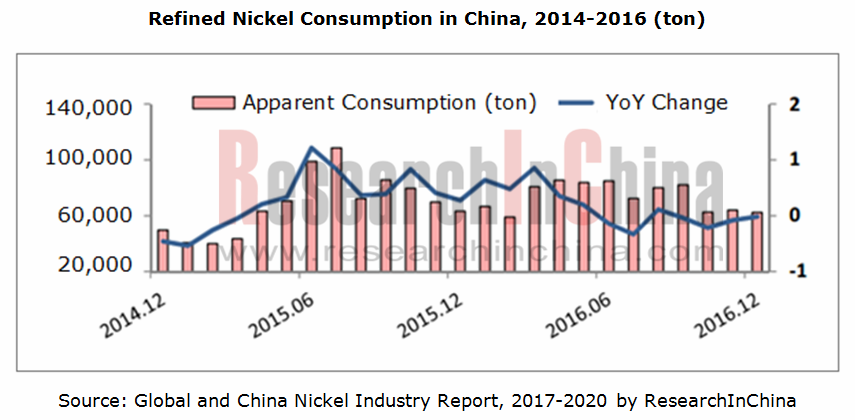
In 2016, China’s primary nickel consumption reached 1.04 million tons, increasing by 6.1% year on year and accounting for 52% of global consumption; the moderated growth was attributed to a slowdown in Chinese stainless steel demand. However, the growing permeability of ternary lithium battery in the field of new energy vehicles stimulates nickel demand from batteries. Concerning China’s primary nickel consumption in 2016, battery accounted for 4%, which would be raised further in the future.
The report highlights the following:
 Global nickel reserves, supply and demand balance, consumption structure, price trend, competitive landscape, etc.;
China’s nickel reserves, supply and demand balance, consumption structure, price trend, industrial profit, as well as enterprise start-up, shut-down, restart, etc.;
China’s nickel product import & export and demand from downstream sectors (stainless steel, battery, etc.);
Operation, nickel ore resource distribution, output, sales volume, price, etc. of 9 nickel enterprises worldwide;
Operation, development plan, nickel ore resource distribution, output, sales volume, price, etc. of 6 nickel enterprises in China.
1. Overview
1.1 Definition
1.2 Industry Chain
2. Global Nickel Market
2.1 Nickel Ore Reserves
2.2 Market Supply
2.3 Market Demand
2.3.1 Demand Value
2.3.2 Demand Structure
2.3.3 Inventory
2.4 Regional Distribution
2.5 Price
2.6 Competitive Landscape
3. China Nickel Market
3.1 Policy
3.2 Nickel Ore Resources
3.3 Market Supply and Demand
3.3.1 Supply
3.3.2 Demand
3.3.3 Price
3.3.4 Industry Chain Profit
3.4 Operating Rate and Maintenance
4. China’s Import and Export of Nickel
5. Demand from Main Downstream Sectors
5.1 Battery Material
5.1.1 Market Development
5.1.2 Nickel Demand
5.2 Stainless Steel
5.2.1 Market Development
5.2.2 Nickel Demand
6. Major Global Nickel Manufacturers
6.1 BHP Billiton
6.1.1 Profile
6.1.2 Operation
6.1.3 Nickel Business
6.2 Glencore Xstrata
6.2.1 Profile
6.2.2 Operation
6.2.3 Nickel Business
6.3 Vale
6.3.1 Profile
6.3.2 Operation
6.3.3 Nickel Business
6.3.4 Business in China
6.4 Sumitomo Metal Mining
6.4.1 Profile
6.4.2 Operation
6.4.3 Nickel Business
6.5 Sherritt International Corporation
6.5.1 Profile
6.5.2 Operation
6.5.3 Nickel Business
6.6 ERAMET
6.6.1 Profile
6.6.2 Operation
6.6.3 Nickel Business
6.6.4 Business in China
6.7 Anglo American
6.7.1 Profile
6.7.2 Operation
6.7.3 Nickel Business
6.8 South32
6.8.1 Profile
6.8.2 Operation
6.8.3 Nickel Business
6.9 MMC Norilsk Nickel
6.9.1 Profile
6.9.2 Operation
6.9.3 Nickel Business
7. Major Chinese Nickel Manufacturers
7.1 Jinchuan Group Co., Ltd.
7.1.1 Profile
7.1.2 Operation
7.1.3 Nickel Business
7.1.4 Development Prospect
7.2 Chengdu Huaze Cobalt & Nickel Material Co., Ltd
7.2.1 Profile
7.2.2 Operation
7.2.3 Nickel Business
7.3 Jilin JIEN Nickel Industry Co., Ltd
7.3.1 Profile
7.3.2 Operation
7.3.3 Nickel Business
7.4 Guangxi Yinyi Science and Technic Mine Metallurgy Co., Ltd.
7.4.1 Profile
7.4.2 Nickel Business
7.4.3 Development Prospect
7.5 Sichuan Ni&Co Guorun New Materials Co., Ltd.
7.6 Xinjiang Xinxin Mining Industry Co., Ltd
7.6.1 Profile
7.6.2 Operation
7.6.3 Nickel Business
Nickel Ores and Production Processes
Nickel Industry Chain
Nickel Reserves in Major Countries, 2016
Global Monthly Balance between Primary Nickel Supply and Demand, 2016-2017 (kt)
Increment in Global Nickel Production, 2016 (10kt)
Decrement in Global Nickel Production, 2016 (10kt)
Cash Cost of Major Foreign Nickel Manufacturers
Global Primary Nickel Production, 2010-2017 (10kt)
Distribution of Nickel Ore Capacity in the Philippines
43% of Philippine Nickel Ores Affected by Audit
Destinations of Philippine Nickel Ore
Global Nickel Ore Production and Indonesian & Philippine Market Share, 2010-2017
Global Primary Nickel Production and Indonesian & Chinese Market Share, 2010-2017
Global Primary Nickel Consumption, 2013-2017 (10kt)
Nickel Consumption Changes by Region, Jan.-Feb. 2017
Global Refined Nickel Consumption, 2014-2016
Global Refined Nickel Supply and Demand Balance Sheet, 2011-2016
Global Primary Nickel Consumption Structure, 2016
Primary Nickel Production (Nickel Metal Quantity) in Major Countries, 2015-2016
Global Primary Nickel Production Breakdown by Country, 2009-2015 (kt)
Global Primary Nickel Consumption by Region, 2013-2016
Global Primary Nickel Consumption Breakdown by Region, 2006-2015 (kt)
Trend of LME Nickel Prices, 2014-2017
Philippine Nickel Ore Quotes, 2011-2017 (RMB/ton)
International Nickel Ore Shipping Cost, 2012-2017
Output of the World’s Top 10 Nickel Enterprises, 2017Q1
Primary Nickel Output (Nickel Metal Quantity) of Major Global Enterprises, 2014-2016 (10kt)
Major Global Nickel Enterprises Closed Down, 2016-2017
Policies on Nickel Industry in China, 2011-2017
Distribution of Nickel Ore Resources in China
China’s Nickel Ore Production, 2004-2016 (10kt)
China’s Nickel-Iron Production, 2005-2017 (10kt)
China’s Nickel-Iron Production Breakdown, 2016-2017 (10kt)
China’s Nickel-Iron or Nickel Production, 2015-2017 (10kt)
China’s Nickel-Iron Import Volume and Output, 2015-2017
China’s Electrolytic Nickel Production, 2016-2017
Net Import Volume of Unwrought Non-Alloy Nickel, 2016-2017 (10kt)
China’s Electrolytic Nickel Supply, 2015-2017
China’s Refined Nickel Consumption, 2014-2016 (ton)
China’s Stainless Steel Nickel Consumption Structure, 2014-2016
Statistics of Nickel Ore Inventory in Ports, 2013-2017 (10kt/week)
Nickel Ore Inventory in Ports by Origin, 2015-2017 (10kt)
Nickel Ore Inventory in Ports by Grade, 2015-2017 (10kt)
China’s Nickel-Iron Inventory, 2015-2017
Laterite-Nickel Ore Prices in Tianjin Port, 2014-2017 (RMB/ton)
Nickel-Iron Prices in Shandong, 2014-2017 (RMB/Nickel Point)
High Nickel-Iron Bidding Price of a Steel Mill in North China, 2013-2017 (RMB/Nickel)
Difference in Chinese High Nickel-Iron and Electrolytic Nickel Prices, 2015-2017 (RMB/ton)
Profit Margin of Blast Furnace High-to-Medium Nickel-Iron in China, 2015-2017
Profit of Stainless Steel with Different Raw Material Proportionings in China, 2015-2017
Comparison of Costs for Stainless Steel Material Purchases in China, 2015-2017
Operating Rate of Chinese Nickel-Iron Enterprises, 2014-2017 (%)
Overall Ore Consumption of Nickel-Iron Manufacturers, 2012-2017 (10kt)
Production and Operation of Low Nickel-Iron Works, Apr.-May 2017
China’s Nickel Ore Import Volume, 2015-2017 (10kt)
China’s Nickel Ores Imported from the Philippines, 2012-2016 (10kt)
China’s Refined Nickel Import and Export Volume, 2015-2017 (10kt)
China’s Nickel Pig Iron Import Volume (ton)
Global Lithium Battery Market Size, 2015-2021E
Global Demand for Small Lithium Cobalt Batteries from 3C Digital Consumer Goods, 2016
China’s Lithium Battery Production, 2011-2016
China’s Lithium Battery Demand Structure, 2016-2020E
Global Shipment of Cathode Materials (LFP/NCM/LCO/LMO/NCA), 2012-2020E
Consumption Structure of Lithium Battery Cathode Materials Worldwide, 2016
Global Shipments of Ternary Cathode Materials, 2009-2020E
Shares (%) of Cathode Materials (LFP, LCO, LMO, NCM) (for Electric Vehicle), 2020E
Shares (%) of Cathode Materials (LFP, LCO, LMO, NCM) (for 3C Consumer Electronics), 2020E
Shipment Percentages of Cathode Materials (NCM/LCO/LFP/LMO) in China, 2015-2016
Ternary Cathode Material (NCM) Shipment in China, 2011-2015
Shipment of Ternary Cathode Materials (NCM/NCA) in China, 2015-2020E
Market Size of Ternary Cathode Materials in China, 2013-2020E
Metal Demand from Different Cathode Materials (per ton)
China’s Nickel Demand from Batteries, 2011-2021E
China’s Stainless Steel Production by Family, 2014-2017 (10kt)
Stainless Steel Crude Steel Output of 17 Chinese Steel Enterprises, 2013-2017
China’s Steel Import and Export Volume, 2015-2017
Stainless Steel Inventory in Wuxi and Foshan, 2012-2017 (ton)
Stainless Steel Inventory in Wuxi and Foshan by Series, 2012-2017 (ton)
Classification of New Stainless Steel Capacity in China
China’s Nickel Demand from Stainless Steel, 2009-2021E
Major Minerals and Interests of BHP Billiton
Revenue of BHP Billiton by Business, FY2016
Revenue of BHP Billiton by Region, FY2016
Revenue of BHP Billiton by Sector, FY2016
Nickel Ore Distribution of BHP Billiton
Nickel Product Output, Sales Volume and Average Price of BHP Billiton, FY 2012-FY2017
Glencore Fact
Glencore Financial Highlights, 2016
Revenue and Net income of Glencore Xstrata, 2012-2016
Revenue Structure (%) of Glencore Xstrata by Business, 2015-2016
Revenue Structure (%) of Glencore Xstrata by region, 2014-2016
Nickel Production from Glencore Xstrata’s own sources, 2015-2016
Nickel Sales Volumes of Glencore Xstrata, 2013-2016
Integrated Nickel Operations (INO) Mineral Resources of Glencore (Raglan, Sudbury), 2016
Integrated Nickel Operations Ore Reserves of Glencore (Raglan, Sudbury)
Global Presence of Vale
Revenue and Net Income of Vale 2008-2016
Revenue Structure of Vale by Business, 2015-2016
Production Summary of Vale by Product, 2011-2015
Sales Volume of Vale by Product, 2011-2015
Revenue Structure of Vale by Region, 20116
Revenue of Vale by Region, 2015-2016
Nickel Output of Vale, 2013-2016
Nickel Output of Vale by Mine Area, 2016-2020E
Nickel Output of Vale by Mine Area, 2013-2017Q1 (kt)
Nickel Product Sales Volume and Average Sales Price of Vale, 2011-2016
Vale’s Revenue from Nickel Products, 2012-2016
Nickel Ore Reserves and Grades of Vale, 2015-2016
Vale Nickel Ore Mines, 2016
Vale in China
Vale’s Revenue and YoY Growth in China, 2010-2016
Vale Annual Cash Break-even Cost Landed in China for Iron Ore and Pellets, 2016
Organizational Structure of Sumitomo Metal Mining
Revenue and Net Income of Sumitomo Metal Mining, FY2008-FY2016
Revenue Structure of Sumitomo Metal Mining by Business, FY2016-FY2017
Overseas Mineral Distribution of Sumitomo Metal Mining
Nickel Capacity Planning of Sumitomo Metal Mining, 2016-2021
Main Mining & Smelting Projects of Sumitomo Metal Mining, 2013-2021
Business Structure of Sherritt
Global Business Layout of Sherritt
Revenue Structure of Sherritt, 2016
Financial Highlights of Sherritt, 2015-2016
Nickel and Cobalt Production of Sherritt Mao JV, 2012-2017
Nickel and Cobalt Production of Sherritt Ambatovy, 2012-2017
Nickel Product Sales Volume and Average Price of Sherritt, 2012-2017
A Group that is Close to Its Clients across the World
Revenue of ERAMET, 2010-2016
Net Income of ERAMET, 2010-2016
Revenue Breakdown of ERAMET, 2016
Nickel Ore Resource Distribution of ERAMET
Business Layout of ERAMET in China
Organizational Structure of ERAMET in China
Anglo American’s Business at a Glance
Revenue Structure of Anglo American by Product, 2016
Revenue Source Structure of Anglo American by Region, 2016
Production Outlook of Anglo American, 2015-2019
EBITDA Margin of Anglo American, 2012-2017
Nickel Ore Resource Distribution of Anglo American
Highlights of Nickel – Anglo American, 2016
Nickel Output, Sales Volume and Average Price of Anglo American, 2013-2016
Nickel Ore Resource Distribution of South32
Nickel Output, Sales Volume and Average Price of South32, 2014-2016
Nickel Output of South32, 2016-2020E
Norilsk Nickel Group around the World
Revenue and Net Income of Norilsk, 2012-2016
Segmental Revenue of Norilsk, 2012-2016
Geographic Revenue Breakdown of Norilsk, 2012-2016
Nickel Production of Norilsk, 2009-2016
Nickel Sales and Average Price of Norilsk, 2009-2016
Revenue and Net income of Jinchuan Group, 2009-2017
Revenue and Proportion of Jinchuan Group by Product, 2013-2016
Gross Margin of Jinchuan Group by Business, 2012-2016
Revenue and Net Income of Chengdu Huaze Cobalt & Nickel Material, 2013-2016
Operating Revenue Breakdown and Structure of Chengdu Huaze Cobalt & Nickel Material by Product, 2014-2016
Operating Revenue Breakdown and Structure of Chengdu Huaze Cobalt & Nickel Material by Region, 2014-2016
Gross Margin of Chengdu Huaze Cobalt & Nickel Material by Product, 2015-2016
Nickel Plate Output and Sales Volume of Chengdu Huaze Cobalt & Nickel Material, 2013-2016
Revenue and Net Income of JIEN Nickel, 2013-2016
Revenue and Gross Margin of Jilin JIEN Nickel Industry by Product, 2015-2016
Nickel Product Output and Sales Volume of Jilin JIEN Nickel Industry by Product, 2014-2016
Revenue and Net Income of Xinjiang Xinxin Mining Industry, 2013-2016
Electrolytic Nickel Output, Sales Volume and Average Price of Xinjiang Xinxin Mining Industry, 2012-2016
Resources and Reserves of Xinjiang Xinxin Mining Industry by the End of 2016
Global and China Rare Earth Permanent Magnet Industry Report, 2018-2023
Rare earth permanent magnets consist of SmCo permanent magnet and NdFeB permanent magnet among which NdFeB as a kind of 3rd-Gen rare earth permanent magnetic material takes a lion’s share of the marke...
Global and China NdFeB Industry Report, 2018-2023
Featured with strong magnetic energy product and high compacted density, NdFeB is widely used in various fields. The NdFeB industry over the recent years has characterized the following:
First, the N...
Global and China Vanadium Industry Report, 2018-2023
Vanadium, deemed as the “vitamin” of metals, finds wide application in steel, chemicals, new materials and new energy. There is now global research and development of vanadium for applying it to more ...
Global and China Cobalt Industry Report, 2018-2023
Cobalt, an essential raw material for lithium battery, is widely used in electric vehicles as well as computer, communication and consumer electronics. 59% of cobalt was used in lithium battery global...
Global and China Nickel Industry Report, 2017-2020
Global primary nickel output in 2016 fell 1.5% to 1.934 million tons. In 2017, as China’s nickel pig iron project in Indonesia reaches design capacity gradually, nickel metal supply is expected to hit...
Global and China Cobalt Industry Report, 2017-2021
In recent years, the global refined cobalt market has been in a state of oversupply, but the inventory has been decreasing year by year. In 2016, the global refined cobalt output and consumption were ...
China Silicon Carbide Industry Report, 2016-2020
China is the largest producer and exporter of silicon carbide in the world, with the capacity reaching 2.2 million tons, sweeping more than 80% of the global total. However, excessive capacity expansi...
China Antimony Industry Report, 2016-2020
According to USGS, global antimony reserves totaled 2 million tons and antimony ore production 150,000 tons in 2015. In China, the reserves of antimony stood at 950,000 tons and antimony ore productio...
Global and China Cobalt Industry Report, 2016-2020
Cobalt is an important strategic metal used in lithium battery manufacturing, hard alloy smelting and superalloy production, mainly available in Congo, Australia, Cuba and other countries.
In 2015, t...
China Silicon Carbide Industry Report, 2015-2019
China is the largest producer and exporter of silicon carbide in the world, with the capacity reaching 2.2 million tons, accounting for more than 80% of the global total. In 2014, the total silicon ca...
Global and China Antimony Industry Report, 2015
Since 2015, China’s antimony industry has been characterized by the followings:
China sees a continued decline in the output of antimony concentrates and antimony products. Owing to weak demand from ...
Global and China Bi-Metal Band Saw Blade Industry Report, 2015-2018
Since the year 2012, due to the aftermath of the global financial crisis and the sub-prime crisis, the prosperity index of manufacturing in China has continued to decline, and the machine tool industr...
Global and China Aluminum Alloy Automotive Sheet Industry Report, 2014-2017
In recent years, driven by energy conservation and emissions reduction and improvement of fuel efficiency, auto industry has been required to develop towards an increasingly lightweight trend. A great...
China Rare Earth Industry Report, 2014-2018
Rare earth, also known as rare earth metal or rare earth element, collectively refers to lanthanides (including fifteen elements) and closely-related scandium and yttrium. As a crucial strategic resou...
China Silicon Carbide Industry Report, 2014-2017
As a major producer and exporter of silicon carbide, China contributes about 80% to the global silicon carbide capacity. In 2013, China exported 286,800 tons of silicon carbide after the abolition of ...
China Antimony Industry Report, 2014-2017
Since 2014, China’s antimony industry has been characterized by the following:
First, China holds a stable position as a major antimony producer. According to the statistics by USGS, in 2013, up...
Global and China Vanadium Industry Report, 2014-2017
The world’s recoverable vanadium reserves so far has been recorded at 14 million tons, mainly found in China, Russia, South Africa and other countries. In 2013, roughly 151,000 tons of vanadium (V2O5 ...
Global and China Silica(White Carbon Black) Industry Report, 2014-2017
China, the world’s largest silica producer, had silica capacity of 2.20 million tons in 2013, slowing to a year-on-year increase of 8.1% and accounting for 60% of global capacity, of which 2.079 milli...