Global and China Cobalt Industry Report, 2016-2020
-
May 2016
- Hard Copy
- USD
$2,500
-
- Pages:138
- Single User License
(PDF Unprintable)
- USD
$2,350
-
- Code:
CYH047
- Enterprise-wide License
(PDF Printable & Editable)
- USD
$3,600
-
- Hard Copy + Single User License
- USD
$2,700
-
Cobalt is an important strategic metal used in lithium battery manufacturing, hard alloy smelting and superalloy production, mainly available in Congo, Australia, Cuba and other countries.
In 2015, the global refined cobalt output was 98,000 tons, up 6.9% year on year; meanwhile, the demand jumped 9.9% year on year to 89,000 tons. The oversupply existed.
In future, the global cobalt demand growth will be much faster than the supply growth with the expected gap of around 1,000 tons in 2020, as the demand for new energy vehicle-use batteries escalates, Congo and other cobalt giants change policies as well as copper-nickel mines are shut down due to price pressures.
China is the world's largest producer of refined cobalt, and contributed 49.7% to the global output in 2015. But, China’s cobalt mineral resources account for only 1% of the world and it depends on the import of cobalt concentrate. In 2015, China’s import volume of cobalt concentrate rose 18.4%year on year to 227,700 tons.
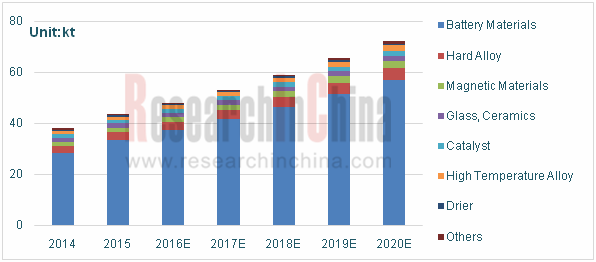
China is the world's largest cobalt consumer as well. Its consumption grew 14.9% year on year to 43,500 tons in 2015, mainly thanks to the growth in the battery material consumption. By contrast, the demand for hard alloy, superalloy and magnetic materials remained relatively stable. In 2015, China consumed 33,500 tons of battery-use cobalt, accounting for 77.0% of the total cobalt consumption, far more than other industries. Conservatively, the proportion of Chinese battery-use cobalt is expected to reach 79% with 56,900 tons by 2020.
Cobalt Demand Structure in China, 2014-2020E
 ?
?
Source: ResearchInChina
Chinese cobalt producersfocus on cobalt smelting, represented by Huayou Cobalt, Jinchuan Group, Green Eco-manufacture Hi-tech, Jinling Mining, Huaze Nickel & Cobalt Metal and so on. In recent years, despite the low cobalt price and mining resource restrictions, the market of ternary materials and other new energy vehicle-use battery materials continues to heat up. In view of this, major manufacturers further expand the industrial chain and accelerate layout of downstream ternary materials and other emerging industries to enhance market competitiveness.
Huayou Cobalt hasthe cobalt smelting capacity of about 16,000 tons asChina's largest cobalt supplier. In 2014, it began to develop ternary cathode materials and cooperated with a number of well-known cathode material manufacturers such as LG, POSCO and GS in certification. The company expects that its ternary precursor sales volume will reach 8,000-9,000 tons in 2016.
Green Eco-manufacture Hi-tech, a leading Chinese enterprise in renewable resources, held about 15,000 tons of cobalt metal in 2015. In recent years, the company has actively deployed the ternary material industry. By the end of 2015, the company had been able to produce 5,000 tons of nickel, cobalt and manganese (NCM) ternary material precursors and 2,000 tons of spherical cobalt hydroxide annually.
China's major cobalt chloride supplier Huaze Nickel & Cobalt Metal had seized the cobalt chloride capacity of 300 tons by the end of 2015. In October 2015, the company announced to invest RMB7.169 billion in the construction of 800,000-ton corrosion-resistant new material project, alloy new material project and 20,000-ton new energy battery material project in order to further extend the industrial chain.
The report highlights the followings:
 Supply and demand, regional distribution, prices, competition patterns and development trends of global cobalt ore resources, cobalt concentrate and refined cobalt;
Supply and demand, prices, competition patterns and development trends of Chinese cobalt ore resources and cobalt;
Import and export of cobalt concentrate, tricobalttetraoxide, cobalt carbonate, cobalt nitrate and other major cobalt products;
Development of battery materials, superalloy, hard alloy, magnetic materials and other major cobalt downstream industries as well as their demand for cobalt;
Operation and development in China of 4 global cobalt companies;
Operation and development strategies of 10 key Chinese cobalt companies.
1. Cobalt Overview
1.1 Definition
1.2 Industry Chain
2. Status Quo of Global Cobalt Market
2.1 Cobalt Ore Reserves
2.2 Market Supply
2.3 Market Demand
2.3.1 Demand Value
2.3.2 Demand Structure
2.4 Regional Distribution
2.5 Price
2.6 Competition Pattern
3. Cobalt Market Development in China
3.1 Policy
3.2 Cobalt Ore Resources
3.3 Market Supply and Demand
3.3.1 Supply
3.3.2 Demand
3.3.3 Price
3.4 Competition Pattern
4. China’s Import and Export of Cobalt by Product
4.1 Cobalt Ores and Concentrates
4.1.1 Import
4.1.2 Regional Structure
4.2 Cobaltosic Oxide
4.2.1 Import and Export
4.2.2 Regional Structure
4.3 Cobalt Chloride
4.3.1 Import and Export
4.3.2 Regional Structure
4.4 Cobalt Carbonate
4.4.1 Import and Export
4.4.2 Regional Structure
4.5 Cobalt Nitrate
4.5.1 Import and Export
4.5.2 Regional Structure
4.6 Cobalt Oxalate
5. Demand of Major Cobalt Downstream Industries
5.1 Battery Materials
5.1.1 Market Development
5.1.2 Demand for Battery Materials-use Cobalt
5.2 Hard Alloy
5.2.1 Market Development
5.2.2 Demand of Hard Alloy for Cobalt
5.3 Magnetic Materials
5.3.1 Market Development
5.3.2 Demand for Magnetic Materials-use Cobalt
5.4 Superalloy
5.4.1 Market Development
5.4.2 Demand for Superalloy-use Cobalt
6. Major Global Cobalt Manufacturers
6.1 Umicore
6.1.1 Profile
6.1.2 Operation
6.1.3 Revenue Structure
6.1.4 R&D
6.1.5 Cobalt Business (Cobalt Specialty Materials)
6.1.6 Business in China
6.1.7 Development Prospect
6.2 Glencore Xstrata
6.2.1 Profile
6.2.2 Operation
6.2.3 Revenue Structure
6.2.4 Cobalt Business
6.3 Vale
6.3.1 Profile
6.3.2 Operation
6.3.3 Revenue Structure
6.3.4 Cobalt Business
6.3.5 Business in China
6.4 Freeport
6.4.1 Profile
6.4.2 Operation
6.4.3 Revenue Structure
6.4.4 Cobalt Business
6.4.5 Business in China
7. Major Chinese Cobalt Producers
7.1 Shenzhen Green Eco-manufacture Hi-tech (002340)
7.1.1 Profile
7.1.2 Operation
7.1.3 Revenue Structure
7.1.4 Suppliers
7.1.5 R&D and Investment
7.1.6 Cobalt Business
7.1.7 Development Prospect
7.2 Huayou Cobalt
7.2.1 Profile
7.2.2 Operation
7.2.3 Revenue Structure
7.2.4 Clients and Suppliers
7.2.6 Cobalt Business
7.2.7 Development Strategy
7.3 Jinchuan Group Co., Ltd.
7.3.1 Profile
7.3.2 Operation
7.3.3 Revenue Structure
7.3.4 Gross Margin
7.3.5 Cobalt Business
7.3.6 Development Prospect
7.4 Shandong Jinling Mining (000655)
7.4.1 Profile
7.4.2 Operation
7.4.3 Revenue Structure
7.4.4 Gross Margin
7.4.5 Cobalt Business
7.5 Chengdu HuazeCobalt&nickel Material Co., Ltd
7.5.1 Profile
7.5.2 Operation
7.5.3 Revenue Structure
7.5.4 Gross Margin
7.5.5 Cobalt Business
7.6 Beijing Easpring Material Technology (300073)
7.6.1 Profile
7.6.2 Operation
7.6.3 Revenue Structure
7.6.4 Gross Margin
7.6.5 Cobalt Business
7.6.6 Development Prospect
7.7 Zhejiang Galico Cobalt & Nickel Material Co., Ltd.
7.8 Ramu Nico Management (Mcc) Limited
7.9 Jiangxi Rare Earth and Rare Metals Tungsten Group Corporation
7.9.1 Profile
7.9.2 Jiangxi Jiangwu Cobalt Co., Ltd.
7.9.3 Jiangxi Jiangwu Nickel and Cobalt New Materials Co., Ltd.
7.9.4 Jiangxi Jiangwu International Nickel and Cobalt New Materials Co., Ltd.
7.10 Nantong Xinwei Nickel & Cobalt Hightech Development Co., Ltd.
8. Conclusion and Forecast
8.1 Conclusion
8.2 Forecast
Cobalt Industry Chain
Products of Major Cobalt Downstream Industries
Cobalt Reserves in Major Countries, 2015
Global Distribution of Associated Cobalt Ore Resources
Global Distribution of Cobalt Ore Output
New Cobalt Ore Projects, 2016-2018E
Global Cobalt Output and YoY Growth, 2005-2015
Global Refined Cobalt Output and YoY Growth, 2005-2015
Distribution of Refined Cobalt Output Worldwide, 2015
Global Cobalt Consumption, 2008-2016
Global Refined Cobalt Supply and Demand Balance Sheet, 2008-2015
Cobalt Demand Structure Worldwide, 2010-2015
Output of Cobalt in Major Countries, 2012-2015 (Unit: ton)
Refined Cobalt Output in Major Countries, 2012-2015(Unit: ton)
Structure (%) of Global Cobalt Consumption by Country/Region
MB Cobalt Price Trend (High / Low), 2014-2016
Cobalt Price Trend in Global LME Future Market, 1995-2015
Structure (%) of Global Refined Cobalt Output by Company, 2015
Global Refined Cobalt Output by Company, 2005-2015
Policies on Cobalt Industry in China, 2011-2016
Cobalt Reserves Distribution in China (By Province)
China’s Output of Cobalt, 2005-2016
China’s Output of Primary Cobalt and YoY Growth, 2005-2015
China’s Cobalt Consumption and YoY Growth, 2006-2016
Cobalt Demand Structure in China, 2009-2016
Cobalt Price Trend in Yangtze Spot Market, 2014-2016
Cobalt Production Capacity of Major Chinese Manufacturers, 2015
Import Volume and Import Value of Cobalt Ores and Concentrates in China, 2006 -2016
China’s Import Volume of Cobalt Ores and Concentrates by Country, 2015
China’s Import Volume and Import Value of Cobaltosic Oxide, 2006 -2016
China’s Export Volume and Export Value of Cobaltosic Oxide, 2006 -2016
Structure (%) of China’s Export Volume of Cobaltosic Oxide by Country, 2015
China’s Import Volume and Import Value of Cobalt Chloride, 2006 -2015
China’s Export Volume and Export Value of Cobalt Chloride, 2006 -2016
Structure (%) of China’s Export Volume of Cobaltosic Oxide by Country, 2015
China’s Import Volume and Import Value of Cobalt Carbonate, 2006-2016
China’s Export Volume and Export Value of Cobalt Carbonate, 2006-2016
Structure (%) of China’s Export Volume of Cobalt Carbonate by Country, 2015
China’s Import Volume and Import Value of Cobalt Nitrate, 2006 -2015
China’s Export Volume and Export Value of Cobalt Nitrate, 2006 -2016
Structure (%) of China’s Export Volume of Cobalt Nitrate by Country, 2015
China’s Export Volume and Export Value of Cobalt Oxalate, 2006 -2016
Cobalt Application Structure, 2015
Global Lithium Ion Battery Output, 2011-2015
Lithium Battery Demand Structure Worldwide, 2012-2020E
Distribution of Global Lithium Ion Battery Industry, 2011-2014
China’s Lithium Battery Output, 2011-2015
Global Shipments of Ternary Cathode Materials (LFP/NCM/LCO/LMO/NCA), 2011-2015
Consumption Structure of Lithium Battery Cathode Materials Worldwide, 2015
Global Shipments of Ternary Cathode Materials, 2009-2020E
Shares (%) of Cathode Materials (LFP, LCO, LMO, NCM) (for Electric Vehicle), 2020E
Shares (%) of Cathode Materials (LFP, LCO, LMO, NCM) (for 3C Consumer Electronics), 2020E
Shipment of Cathode Materials (NCM/LCO/LFP/LMO) in China, 2011-2015
Output of Cathode Materials (NCM/LCO/LFP/LMO) in China, 2014Q1-2015Q2
Shipment of Ternary Cathode Materials (NCM) in China, 2011-2015
Shipment of Ternary Cathode Materials (NCM/NCA) in China, 2015-2020E
Amount of Cobalt Consumed by Different Ternary Cathode Materials
Demand Structure of Battery Industry for Cobalt
Global Battery-use Cobalt Demand, 2008-2020E
China’s Demand for Battery Materials-use Cobalt, 2008-2020E
Classification of Hard Alloy (by Component)
Global Hard Alloy Output by Region, 2015
China’s Hard Alloy Output, 2009-2020E
Global Demand for Hard Alloy-use Cobalt, 2009-2020E
China’s Demand for Hard Alloy-use Cobalt, 2009-2020E
Global NdFeB Output and Growth Rate, 2008-2018E
Global NdFeB Output Structure (by Country), 2014
Global and China’s Demand for Magnetic Materials-use Cobalt, 2009-2020E
Applications of Superalloy
China’s Demand for Aerospace-use Superalloy, 2010-2017E
Global Demand for Superalloy-use Cobalt, 2009-2020E
China’s Demand for Superalloy-use Cobalt, 2009-2020E
Distribution of Umicore’s Plants
Revenue and Net income of Umicore, 2008-2015
Revenue of Umicore by Business, 2011-2015
Revenue of Umicore by Business, 2015
Energy & Surface Technologies Business Group Profile
Growth and Profitability Drivers of Energy & Surface Technologies Business Group
Total Revenue Structure (%) of Umicore by Region, 2012-2015
R&D Costs and % of Total Revenue of Umicore, 2006-2015
Revenue and Profit from Energy & Surface Technologies Business of Umicore, 2011-2015
Output and YoY Growth of Refined Cobalt of Umicore, 2001-2015
Umicore’s Major Construction Projects in China, 2012-2015E
Revenue and Net income of Glencore Xstrata, 2012-2015
Revenue Structure (%) of Glencore Xstrata by Business, 2015
Revenue Structure (%) of Glencore Xstrata by region, 2014-2015
Cobalt Output of Glencore Xstrata by Mine Area, 2013-2015
Principal Subsidiaries engaged in Cobalt Production of Glencore Xstrata
Global Presence of Vale
Revenue and Net Income of VALE, 2008-2016
Financial Highlights of VALE, 2011-2015
Gross Revenue of VALE, 2015Q4
Revenue Structure of VALE by Business, 2014-2016
Production Summary of Vale by Product, 2011-2015
Sales Volume of Vale by Product, 2011-2015
Revenue Structure of VALE by Region, 2012-2016
Production Volume of VALE, 2014-2016
Cobalt Output of Vale by Mine Area, 2010-2016
Cobalt Product Sales Volume and Average Sales Price of Vale, 2013-2015
Vale’s Revenue from Cobalt Products, 2011-2015
Cobalt Ore Reserves and Grades of Vale, 2014-2015
Vale’s Revenue and YoY Growth in China, 2010-2016
Freeport’s Mineral Distribution
Revenue and Net income of Freeport, 2008-2015
Revenue Structure (%) of Freeport by Product, 2012-2015
Revenue Breakdown of Freeport by Country/Region, 2010-2015
Cobalt Business Revenue and Gross Profit of Freeport, 2010-2015
Cobalt Output and Sales Volume and Average Price of Freeport, 2010-2015
Revenue and YoY Growth of Freeport in China, 2008-2015
Revenue and Net income of Shenzhen Green Eco-Manufacture, 2010-2016
Operating Revenue of Shenzhen Green Eco-Manufacture by Region, 2010-2015
R&D Costs and % of Total Revenue of Shenzhen Green Eco-Manufacture, 2010-2015
Revenue and Net income of Shenzhen Green Eco-Manufacture, 2015-2020E
Development Course of Huayou Cobalt
Revenue and Net income of Huayou Cobalt, 2010-2015
Revenue and Net Income of Huayou Cobalt’s Major Subsidiaries, 2015
Operating Revenue of Huayou Cobalt (by Region), 2012-2015
Major Customers of Huayou Cobalt
Cobalt Metal Volume and Market Share of Huayou Cobalt, 2011-2015
Capacity and Output of Jinchuan Group’s Main Products, 2012-2015
Revenue and Net income of Jinchuan Group, 2009-2015
Gross Margin of Jinchuan Group by Business, 2012-2015
Cobalt Metal Production and Sales of Jinchuan Group, 2010-2015
Cobalt Product Revenue of Jinchuan Group, 2010-2015
Revenue and Net income of Shandong Jinling Mining, 2007-2015
Revenue Structure of Shandong Jinling Mining by Product, 2012-2015
Revenue of Shandong Jinling Mining by Region, 2008-2015
Gross Margin of Shandong Jinling Mining by Product, 2008-2015
Revenue from Cobalt Concentrate Powder of Shandong Jinling Mining, 2008-2015
Revenue and Net income of HuazeCobalt&nickel, 2013-2015
Operating Revenue Breakdown and Percentage of Huaze Nickel & Cobalt Metal (by Product), 2014-2015
Operating Revenue Breakdown and Percentage of Huaze Nickel & Cobalt Metal (by Region), 2014-2015
Gross Margin of Huaze Nickel & Cobalt Metal (by Product), 2015
Cobalt Chloride Output and Sales Volume of Huaze Nickel & Cobalt Metal, 2013-2015
Revenue and Net Income of Beijing Easpring Material, 2007-2015
Revenue of Beijing Easpring Material by Business, 2010-2015
Revenue of Beijing Easpring Material by Region, 2008-2015
Gross Margin of Beijing Easpring Material by Business, 2008-2014
Gross Margin of Beijing Easpring Material by Business, 2015
Sales Volume of Ternary Cathode Materials of Beijing Easpring Material Technology, 2011-2016E
Revenue and Net Income of Beijing Easpring Material, 2015-2020
Shareholding Structure of Projects of Ramu Nico Management Limited
Nickel and Cobalt Companies of Jiangxi Rare Earth and Rare Metals Tungsten Group Corporation
Revenue and Cobalt Revenue of Major Global and Chinese Cobalt Producers, 2014-2015
Cobalt Product Output and Sales Volume of Major Global and Chinese Cobalt Producers, 2013-2015
Global Cobalt material Output (by Enterprise / Mine) , 2014-2015
Global Refined Cobalt Supply and Demand Balance Sheet, 2015-2020
Cobalt Demand Structure Worldwide, 2015-2020E
Cobalt Demand Structure in China, 2014-2020E
Global and China Rare Earth Permanent Magnet Industry Report, 2018-2023
Rare earth permanent magnets consist of SmCo permanent magnet and NdFeB permanent magnet among which NdFeB as a kind of 3rd-Gen rare earth permanent magnetic material takes a lion’s share of the marke...
Global and China NdFeB Industry Report, 2018-2023
Featured with strong magnetic energy product and high compacted density, NdFeB is widely used in various fields. The NdFeB industry over the recent years has characterized the following:
First, the N...
Global and China Vanadium Industry Report, 2018-2023
Vanadium, deemed as the “vitamin” of metals, finds wide application in steel, chemicals, new materials and new energy. There is now global research and development of vanadium for applying it to more ...
Global and China Cobalt Industry Report, 2018-2023
Cobalt, an essential raw material for lithium battery, is widely used in electric vehicles as well as computer, communication and consumer electronics. 59% of cobalt was used in lithium battery global...
Global and China Nickel Industry Report, 2017-2020
Global primary nickel output in 2016 fell 1.5% to 1.934 million tons. In 2017, as China’s nickel pig iron project in Indonesia reaches design capacity gradually, nickel metal supply is expected to hit...
Global and China Cobalt Industry Report, 2017-2021
In recent years, the global refined cobalt market has been in a state of oversupply, but the inventory has been decreasing year by year. In 2016, the global refined cobalt output and consumption were ...
China Silicon Carbide Industry Report, 2016-2020
China is the largest producer and exporter of silicon carbide in the world, with the capacity reaching 2.2 million tons, sweeping more than 80% of the global total. However, excessive capacity expansi...
China Antimony Industry Report, 2016-2020
According to USGS, global antimony reserves totaled 2 million tons and antimony ore production 150,000 tons in 2015. In China, the reserves of antimony stood at 950,000 tons and antimony ore productio...
Global and China Cobalt Industry Report, 2016-2020
Cobalt is an important strategic metal used in lithium battery manufacturing, hard alloy smelting and superalloy production, mainly available in Congo, Australia, Cuba and other countries.
In 2015, t...
China Silicon Carbide Industry Report, 2015-2019
China is the largest producer and exporter of silicon carbide in the world, with the capacity reaching 2.2 million tons, accounting for more than 80% of the global total. In 2014, the total silicon ca...
Global and China Antimony Industry Report, 2015
Since 2015, China’s antimony industry has been characterized by the followings:
China sees a continued decline in the output of antimony concentrates and antimony products. Owing to weak demand from ...
Global and China Bi-Metal Band Saw Blade Industry Report, 2015-2018
Since the year 2012, due to the aftermath of the global financial crisis and the sub-prime crisis, the prosperity index of manufacturing in China has continued to decline, and the machine tool industr...
Global and China Aluminum Alloy Automotive Sheet Industry Report, 2014-2017
In recent years, driven by energy conservation and emissions reduction and improvement of fuel efficiency, auto industry has been required to develop towards an increasingly lightweight trend. A great...
China Rare Earth Industry Report, 2014-2018
Rare earth, also known as rare earth metal or rare earth element, collectively refers to lanthanides (including fifteen elements) and closely-related scandium and yttrium. As a crucial strategic resou...
China Silicon Carbide Industry Report, 2014-2017
As a major producer and exporter of silicon carbide, China contributes about 80% to the global silicon carbide capacity. In 2013, China exported 286,800 tons of silicon carbide after the abolition of ...
China Antimony Industry Report, 2014-2017
Since 2014, China’s antimony industry has been characterized by the following:
First, China holds a stable position as a major antimony producer. According to the statistics by USGS, in 2013, up...
Global and China Vanadium Industry Report, 2014-2017
The world’s recoverable vanadium reserves so far has been recorded at 14 million tons, mainly found in China, Russia, South Africa and other countries. In 2013, roughly 151,000 tons of vanadium (V2O5 ...
Global and China Silica(White Carbon Black) Industry Report, 2014-2017
China, the world’s largest silica producer, had silica capacity of 2.20 million tons in 2013, slowing to a year-on-year increase of 8.1% and accounting for 60% of global capacity, of which 2.079 milli...