Global and China Vanadium Industry Report, 2018-2023
-
Nov.2018
- Hard Copy
- USD
$2,800
-
- Pages:95
- Single User License
(PDF Unprintable)
- USD
$2,600
-
- Code:
ZHP081
- Enterprise-wide License
(PDF Printable & Editable)
- USD
$3,900
-
- Hard Copy + Single User License
- USD
$3,000
-
Vanadium, deemed as the “vitamin” of metals, finds wide application in steel, chemicals, new materials and new energy. There is now global research and development of vanadium for applying it to more industries.
Before climbing to the estimated 151,000 tons in 2018, global vanadium output began to pick up in 2017, by 2.1% from a year earlier to 148,000 tons (V2O5), largely because output in Brazil and China rose. Global vanadium output will keep an average annual growth rate of 3.5% or so between 2018 and 2023.
China as the world’s largest vanadium producer reported output of 84,000 tons (V2O5) in 2017, 3.3% more than in the previous year, and a 57% share of the global total, which showed Chinese players’ more enthusiasm for production. With rising price and demand, China’s vanadium output will keep growing in the forthcoming years but at a moderate pace due to the government’s environmental campaigns and its ban on the import of vanadium slags. It is predicted that vanadium output in China will present an AAGR of 3.5%-4.5% from 2018 to 2023, a bit above the global average.
As concerns market demand in China, over 85% of vanadium products are consumed by steel sector. The new national standard, GB/T 1499.2-2018 Steel for the Reinforcement of Concrete -- Part 2: Hot Rolled Ribbed Bars effective from November 2018, requires that some alloy elements like vanadium and bismuth should be added to new ribbed bars, but mere 30% of products in China are subject to the new standard. Accordingly, China will see soaring demand for vanadium after 2018, with an AAGR of around 10.0%.
As for market price, the Chinese Government’s environmental supervision and the policy of prohibiting the import of vanadium slags led to price hikes of vanadium in the second half of 2017; in 2018, vanadium (V2O5) price shot up again from RMB20,000/ton in January to RMB46,000/ton in October, a spurt of roughly 130%, which was caused by the issuance of the new ribbed bar standard at the start of the year and a slump in vanadium inventory. So still a certain gap will remain between supply and demand in the next a few years, showing little sign of price decline.
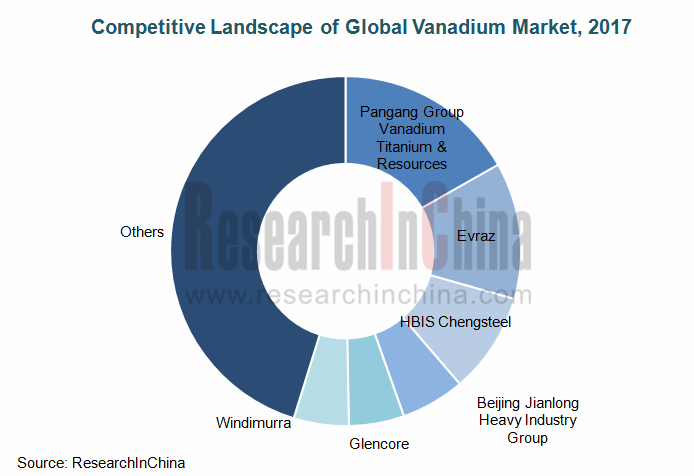
The world-renowned vanadium producers consist of Pangang Group Vanadium Titanium & Resources Co., Ltd., HBIS Chengsteel, Russia’s Evraz and Switzerland-based Glencore. In 2017, Pangang Group Vanadium Titanium & Resources Co., Ltd. as the largest producer among them, seized a market share of 16.8%; Evraz followed, with 12.6%.
Global and China Vanadium Industry Report, 2018-2023 highlights the following:
 Vanadium (definition, industry chain, etc.);
Global vanadium market (resource reserves, supply & demand, prices, competitive pattern, etc.);
Chinese vanadium market (resource reserves, supply & demand, prices, import & export, competitive pattern, application, etc.);
5 foreign and 11 Chinese vanadium producers (operation, vanadium business, etc.).
1. Introduction to Vanadium
1.1 Definition
1.2 Industry Chain
2. Global Vanadium Market
2.1 Vanadium Ore Resources
2.2 Market Size
2.2.1 Supply
2.2.2 Demand
2.3 Price
2.4 Competitive Landscape
3. China Vanadium Market
3.1 Vanadium Ore Resources
3.2 Market Size
3.2.1 Supply
3.2.2 Demand
3.3 Price
3.4 Import and Export
3.5 Competitive Landscape
3.6 Applied Markets
3.6.1 Iron & Steel
3.6.2 Vanadium Battery
4. Major Vanadium Manufacturers in the World
4.1 Evraz
4.1.1 Profile
4.1.2 Operation
4.1.3 Revenue Structure
4.1.4 Vanadium Business
4.2 VanadiumCorp
4.2.1 Profile
4.2.2 Vanadium Business
4.3 Others
4.3.1 Glencore
4.3.2 Treibacher Industrie AG
4.3.3 ATLANTIC LTD
5. Major Vanadium Manufacturers in China
5.1 Pangang Group Vanadium Titanium & Resources
5.1.1 Profile
5.1.2 Operation
5.1.3 Revenue Structure
5.1.4 Gross Margin
5.1.5 Clients and Suppliers
5.1.6 Vanadium Business
5.2 Xining Special Steel
5.2.1 Profile
5.2.2 Operation
5.2.3 Revenue Structure
5.2.4 Gross Margin
5.2.5 Clients and Suppliers
5.2.6 Vanadium Business
5.3 Hebei Iron & Steel
5.3.1 Profile
5.3.2 Operation
5.3.3 Revenue Structure
5.3.4 Gross Margin
5.3.5 Clients and Suppliers
5.3.6 Vanadium Business
5.4 Guangdong Boxin Investing & Holdings
5.4.1 Profile
5.4.2 Operation
5.4.3 Revenue Structure
5.4.4 Gross Margin
5.4.5 Vanadium Business
5.5 Pengqi Technology Development Co., Ltd.
5.5.1 Profile
5.5.2 Operation
5.5.3 Revenue Structure
5.5.4 Gross Margin
5.5.5 Clients and Suppliers
5.5.6 Vanadium Business
5.6 Sichuan Mingxing Electric Power
5.6.1 Profile
5.6.2 Operation
5.6.3 Revenue Structure
5.6.4 Gross Margin
5.6.5 Clients and Suppliers
5.6.6 Vanadium Business
5.7 Berry Genomics Co., Ltd.
5.7.1 Profile
5.7.2 Operation
5.7.3 Revenue Structure
5.7.4 Gross Margin
5.7.5 Clients and Suppliers
5.7.6 Vanadium Business
5.8 Zhejiang Hailiang
5.8.1 Profile
5.8.2 Operation
5.8.3 Revenue Structure
5.8.4 Gross Margin
5.8.5 Clients and Suppliers
5.8.6 Vanadium Business
5.9 Others
5.9.1 HBIS Chengsteel
5.9.2 Beijing Jianlong Heavy Industry Group Co., Ltd.
5.9.3 Panzhihua Gangcheng Group
Utilization Ways for Major Vanadium Resources in the World
Vanadium Industry Chain
Basic Technical Indicators about Production of Vanadium Products
Proportion of Global Vanadium Reserves (by Country)
Proportion of Global Recoverable Vanadium Reserves (by Country)
Global Vanadium Production, 2016-2023E
Proportion of Global Vanadium Production (by Country/Region), 2017
Proportion of Global Vanadium Production (by Different Raw Materials), 2017
Global Vanadium Production (by Country/Region), 2000-2017
Changes in Global Vanadium Product Inventory, 1994-2017
Proportion of Global Vanadium Consumption (by Country/Region), 2017
Proportion of Global Vanadium Consumption (by Applications), 2017
Global Vanadium Consumption (by Country/Region), 2001-2017
Specific Vanadium Consumption Rates in Major Regions Worldwide, 2017
Ferrovanadium Price (80%T2) and Ribbed Bar Price in the World, 2003-2018
Price Trend of Vanadium Pentoxide in China and Europe, 2015-2018
Competitive Pattern of Global Vanadium Products (V2O5) Market, 2017
Types of Vanadium Resources in China
Structure of Vanadium Reserves (by Province/Municipality) in China
Distribution of Vanadium Ore Resources in China
Vanadium (V2O5 Equivalent) Production in China, 2008-2023E
Production of Major Vanadium Pentoxide Manufacturers in China, 2017-2018
Operating Rate of Chinese Vanadium Pentoxide Manufacturers, 2017-2018
Inventories of Chinese Vanadium Pentoxide Manufacturers, 2017-2018
Consumption of Vanadium Products (V2O5 Equivalent) in China, 2008-2023E
Proportion of China Vanadium Consumption (by Applications), 2017
Price Trend of Vanadium Products in China, 2016-2018
Price Trend of Vanadium Pentoxide (V2O5) in China, 2017-2018
Import Volume and Value of Vanadium Pentoxide (V2O5) in China, 2011-2017
Export Volume and Value of Vanadium Pentoxide (V2O5) in China, 2011-2017
China’s Export Volume and Value of Vanadium Pentoxide (V2O5) to Top 10 Export Destinations, 2017
Competitive Landscape of Vanadium Pentoxide (by Capacity) in China, 2017
Competitive Landscape of Chinese Ferrovanadium Market, 2017
Competitive Landscape of Vanadium Pentoxide (by Output) in China, 2017
Eliminated Capacity of “ditiaogang” (Low-quality Steel Made from Scrap Metal) in Provinces and Municipalities in China, 2017
Addition of Vanadium Alloy in China’s Standards on Ribbed Bars
Sensitivity of Vanadium Demand in the Ribbed Bars Field
Vanadium Products Bidding Plan of Key Steelworks, 2018
Iron & Steel Products’ Consumption of Vanadium (by Country/Region) Worldwide, 2001-2020E
Technical Indices of Different Batteries
Global Demand for Vanadium Products from Vanadium Redox Flow Battery, 2010-2018
Revenue and Net Income of Evraz, 2009-2018
Revenue of Evraz (by Business), 2016-2017
Revenue of Evraz (by Business), 2017-2018
Revenue Structure of Evraz (by Region), 2016-2017
Revenue Structure of Evraz (by Region), 2017-2018
Vanadium Product Sales of Evraz, 2016-2017
Highveld Steel & Vanadium Operation of Evraz
Vanadium Ore Resources of Evraz
Structure of Evraz’ Revenue from Vanadium Products, 2017
Vanadium Slag Output of Evraz (by Plant), 2017
Operation of Glencore, 2016-2017
Operation of Glencore (by Product), 2016-2017
Output of Glencore (by Product), 2016-2017
Workforce of Treibacher, 2015-2017
Revenue of Treibacher, 2015-2017
Revenue Structure of Treibacher (by Region), 2017
Introduction to Windimurra Vanadium Project
Revenue and Net Income of Pangang Group Vanadium Titanium & Resources, 2009-2018
Revenue Structure of Pangang Group Vanadium Titanium & Resources (by Product), 2016-2017
Revenue Structure of Pangang Group Vanadium Titanium & Resources (by Region), 2016-2017
Gross Margin of Pangang Group Vanadium Titanium & Resources (by Product), 2009-2018
Pangang Group Vanadium Titanium & Resources’ Combined Procurement from Top 5 Suppliers and % of Total Procurement, 2009-2017
Pangang Group Vanadium Titanium & Resources’ Combined Revenue from Top 5 Customers and % of Total Revenue, 2008-2017
Production and Sales Volume of Vanadium Products of Pangang Group Vanadium Titanium & Resources, 2011-2017
Cost Structure of Vanadium Products of Pangang Group Vanadium Titanium & Resources, 2017
Revenue from Vanadium Products of Pangang Group Vanadium Titanium & Resources, 2009-2018
Revenue and Net Income of Xining Special Steel, 2009-2018
Revenue Structure of Xining Special Steel (by Product), 2009-2017
Revenue Structure of Xining Special Steel (by Region), 2009-2017
Gross Margin of Xining Special Steel (by Product), 2010-2017
Xining Special Steel’s Combined Procurement from Top 5 Suppliers and % of Total Procurement, 2009-2017
Xining Special Steel’s Combined Revenue from Top 5 Customers and % of Total Revenue, 2009-2017
Revenue and Net Income of Hebei Iron & Steel, 2009-2018
Revenue Structure of Hebei Iron & Steel (by Business), 2009-2018
Revenue Structure of Hebei Iron & Steel (by Region), 2009-2018
Gross Margin of Hebei Iron & Steel (by Product), 2009-2018
Hebei Iron & Steel’s Combined Procurement from Top 5 Suppliers and % of Total Procurement, 2009-2017
Hebei Iron & Steel’s Combined Revenue from Top 5 Customers and % of Total Revenue, 2009-2017
Vanadium Slag Output of Hebei Iron & Steel, 2009-2018
Revenue from Vanadium Products of Hebei Iron & Steel, 2009-2018
Revenue and Net Income of Guangdong Boxin Investing & Holdings, 2009-2018
Revenue Structure of Guangdong Boxin Investing & Holdings (by Business), 2012-2017
Gross Margin of Guangdong Boxin Investing & Holdings (by Product), 2012-2017
Vanadium Resource Reserves of Guizhou Boxin Mining Co., Ltd.
Revenue and Net Income of Pengqi Technology Development Co., Ltd., 2009-2018
Revenue Structure of Pengqi Technology Development Co., Ltd. (by Business), 2016-2017
Revenue Structure of Pengqi Technology Development Co., Ltd. (by Region), 2016-2017
Gross Margin of Pengqi Technology Development Co., Ltd. (by Product), 2015-2017
Pengqi Technology Development Co., Ltd.’s Combined Revenue from Top 5 Customers and % of Total Revenue, 2009-2017
Revenue and Net Income of Sichuan Mingxing Electric Power, 2009-2018
Revenue Structure of Sichuan Mingxing Electric Power (by Business), 2009-2018
Revenue Structure of Sichuan Mingxing Electric Power (by Region), 2014-2017
Gross Margin of Sichuan Mingxing Electric Power (by Product), 2009-2018
Sichuan Mingxing Electric Power’s Combined Revenue from Top 5 Customers and % of Total Revenue, 2009-2017
Sichuan Mingxing Electric Power’s Combined Procurement from Top 5 Suppliers and % of Total Procurement, 2011-2017
Revenue and Net Income of Berry Genomics Co., Ltd., 2009-2018
Revenue Structure of Berry Genomics Co., Ltd. (by Business), 2017-2018
Revenue Structure of Berry Genomics Co., Ltd. (by Region), 2009-2018
Gross Margin of Berry Genomics Co., Ltd. (by Product), 2016-2018
Berry Genomics Co., Ltd.’s Combined Procurement from Top 5 Suppliers and % of Total Procurement, 2009-2017
Berry Genomics Co., Ltd.’s Combined Revenue from Top 5 Customers and % of Total Revenue, 2009-2017
Revenue and Net Income of Zhejiang Hailiang, 2009-2018
Revenue Structure of Zhejiang Hailiang (by Business), 2009-2018
Revenue Structure of Zhejiang Hailiang (by Region), 2009-2018
Gross Margin of Zhejiang Hailiang (by Product), 2009-2018
Zhejiang Hailiang’s Combined Procurement from Top 5 Suppliers and % of Total Procurement, 2009-2017
Zhejiang Hailiang’s Combined Revenue from Top 5 Customers and % of Total Revenue, 2009-2017
Marketing Network of HBIS Chengsteel
Vanadium Products Production of HBIS Chengsteel, 2017-2018
Vanadium Pentoxide Production of Panzhihua Gangcheng Group, 2014-2017
Global and China Rare Earth Permanent Magnet Industry Report, 2018-2023
Rare earth permanent magnets consist of SmCo permanent magnet and NdFeB permanent magnet among which NdFeB as a kind of 3rd-Gen rare earth permanent magnetic material takes a lion’s share of the marke...
Global and China NdFeB Industry Report, 2018-2023
Featured with strong magnetic energy product and high compacted density, NdFeB is widely used in various fields. The NdFeB industry over the recent years has characterized the following:
First, the N...
Global and China Vanadium Industry Report, 2018-2023
Vanadium, deemed as the “vitamin” of metals, finds wide application in steel, chemicals, new materials and new energy. There is now global research and development of vanadium for applying it to more ...
Global and China Cobalt Industry Report, 2018-2023
Cobalt, an essential raw material for lithium battery, is widely used in electric vehicles as well as computer, communication and consumer electronics. 59% of cobalt was used in lithium battery global...
Global and China Nickel Industry Report, 2017-2020
Global primary nickel output in 2016 fell 1.5% to 1.934 million tons. In 2017, as China’s nickel pig iron project in Indonesia reaches design capacity gradually, nickel metal supply is expected to hit...
Global and China Cobalt Industry Report, 2017-2021
In recent years, the global refined cobalt market has been in a state of oversupply, but the inventory has been decreasing year by year. In 2016, the global refined cobalt output and consumption were ...
China Silicon Carbide Industry Report, 2016-2020
China is the largest producer and exporter of silicon carbide in the world, with the capacity reaching 2.2 million tons, sweeping more than 80% of the global total. However, excessive capacity expansi...
China Antimony Industry Report, 2016-2020
According to USGS, global antimony reserves totaled 2 million tons and antimony ore production 150,000 tons in 2015. In China, the reserves of antimony stood at 950,000 tons and antimony ore productio...
Global and China Cobalt Industry Report, 2016-2020
Cobalt is an important strategic metal used in lithium battery manufacturing, hard alloy smelting and superalloy production, mainly available in Congo, Australia, Cuba and other countries.
In 2015, t...
China Silicon Carbide Industry Report, 2015-2019
China is the largest producer and exporter of silicon carbide in the world, with the capacity reaching 2.2 million tons, accounting for more than 80% of the global total. In 2014, the total silicon ca...
Global and China Antimony Industry Report, 2015
Since 2015, China’s antimony industry has been characterized by the followings:
China sees a continued decline in the output of antimony concentrates and antimony products. Owing to weak demand from ...
Global and China Bi-Metal Band Saw Blade Industry Report, 2015-2018
Since the year 2012, due to the aftermath of the global financial crisis and the sub-prime crisis, the prosperity index of manufacturing in China has continued to decline, and the machine tool industr...
Global and China Aluminum Alloy Automotive Sheet Industry Report, 2014-2017
In recent years, driven by energy conservation and emissions reduction and improvement of fuel efficiency, auto industry has been required to develop towards an increasingly lightweight trend. A great...
China Rare Earth Industry Report, 2014-2018
Rare earth, also known as rare earth metal or rare earth element, collectively refers to lanthanides (including fifteen elements) and closely-related scandium and yttrium. As a crucial strategic resou...
China Silicon Carbide Industry Report, 2014-2017
As a major producer and exporter of silicon carbide, China contributes about 80% to the global silicon carbide capacity. In 2013, China exported 286,800 tons of silicon carbide after the abolition of ...
China Antimony Industry Report, 2014-2017
Since 2014, China’s antimony industry has been characterized by the following:
First, China holds a stable position as a major antimony producer. According to the statistics by USGS, in 2013, up...
Global and China Vanadium Industry Report, 2014-2017
The world’s recoverable vanadium reserves so far has been recorded at 14 million tons, mainly found in China, Russia, South Africa and other countries. In 2013, roughly 151,000 tons of vanadium (V2O5 ...
Global and China Silica(White Carbon Black) Industry Report, 2014-2017
China, the world’s largest silica producer, had silica capacity of 2.20 million tons in 2013, slowing to a year-on-year increase of 8.1% and accounting for 60% of global capacity, of which 2.079 milli...