Global and China Automotive Drive Shaft Market Report, 2015
-
July 2015
- Hard Copy
- USD
$2,600
-
- Pages:130
- Single User License
(PDF Unprintable)
- USD
$2,400
-
- Code:
ZN022
- Enterprise-wide License
(PDF Printable & Editable)
- USD
$3,700
-
- Hard Copy + Single User License
- USD
$2,800
-
China needed 62.44 million automotive drive shafts in 2014, of which 79% came from passenger vehicles. Up to now, Chinese automotive drive shaft companies have been capable of developing and producing drive shafts for construction machinery, commercial vehicles and passenger vehicles. However, most of domestic drive shaft producers are small sized and focus on low- and mid-range products, compared with a lower proportion of high-precision, high technical content and high value added products, especially high-end constant velocity (CV) drive shaft market, which is still dominated by foreign brands.
Drive shaft, depending on whether constant angular velocity rotates or not, can be divided into CV drive shaft and non-CV drive shaft.
CV drive shaft, primarily used in passenger vehicle market, enjoys huge market demand. Shanghai GKN Drive Shaft Co., Ltd. (SDS), a supplier holing a dominant position, is a joint venture of GKN Driveline International GmbH and HUAYU Automotive Systems Co., Ltd. SDS now has production bases in Kangqiao (Shanghai), Chongqing, Wuhan and Changchun. GKN Drive Shaft (Chongqing) Co. Ltd. is a joint venture established by SDS and Chang'an Automobile Group.
Non-CV drive shaft is principally used in commercial vehicles, construction machinery, and a small minority of passenger vehicles. Due to limited demand from downstream markets in recent years, non-CV drive shaft market has been highly competitive. Major players in the field include XuchangYuandong Drive Shaft Co., Ltd. and WanxiangQianchao Co., Ltd.
XuchangYuandong Drive Shaft Co., Ltd. is the largest non-CV drive shaft manufacturer in China, producing mainly drive shafts for variedconstruction machineryincluding light, medium-duty and heavy trucks, pickups, SUVs, buses, loaders and cranes. In 2014, the company sold 3.5007 million drive shafts, up 19.06% from 2.9402 million units in 2013, mainly due to significant rise in sales of light drive shaft arising from adjustment in sales structure.
WanxiangQianchao had drive shaft capacity of 4 million units and sold 3.29 million units in 2014. The production of drive shaft is chiefly undertaken by Qianchao Transmission Shaft Co., Ltd., which has 5 factories and 1 research institute, producing mainly drive shafts, steering columns, EPS and other auto parts. Due to a fiercely competitive drive shaft market, the company underwent a decline in drive shaft utilization to 83% in 2014 from 97% in 2013.
Layout of Major Foreign Drive Shaft Companies in China, 2015
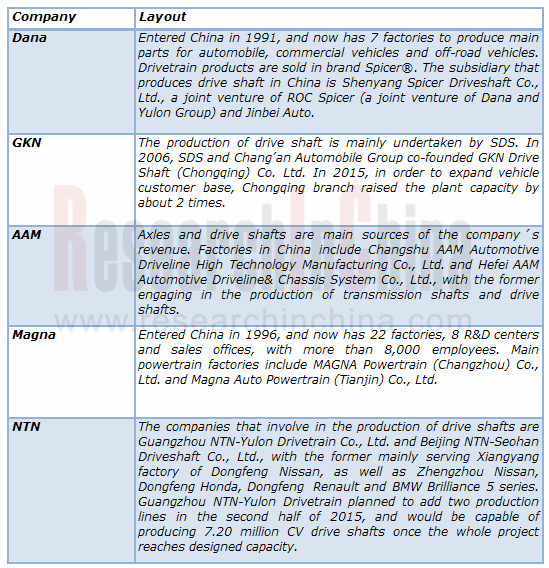
Source: ResearchInChina
The report highlights the followings:
 Overview of China automotive drive shaft industry, including definition, classification, etc.;
Overall study into the Chinese automotive drive shaft market, covering demand, market competition pattern, latest market characteristics;
Study into the Chinese automotive drive shaft market segments, CV drive shaft and non-CV drive shaft market demands and major companies;
Study into major Chinese automotive drive shaft companies, comprising operation, output and sales volume of drive shaft, main customers, and new products.
1 Macro-economy
1.1 GDP
1.2 Fixed-asset Investment
1.3 Import and Export
1.4 Total Retail Sales of Consumer Goods
2 Definition and Classification of Drive Shaft
2.1 Definition
2.2 Composition
2.2.1 Universal Joint
2.2.2 Flexible Sleeve
2.2.3 Shaft Sleeve
2.3 Technical Standards
2.3.1 Performance Requirements and Test Methods for Automobile Steering Drive Shaft Assembly
2.3.2 Test Methods and Technical Conditions for Automotive Drive Shaft Assembly Rack
2.3.3 Test Methods for Automotive CV Universal Joint and Assembly
2.4 Business Model
2.5 Industry Chain
3 Global and China Drive Shaft Downstream Industries
3.1 Global Market
3.2 Chinese Market
3.2.1 Automobile Industry
3.2.2 Output and Sales Volume by Auto Model
4 Drive Shaft Market
4.1 Global
4.2 China
4.3 Drive Shaft Market Demand
4.3.1 Overall
4.3.2 Non-CV Drive Shaft
4.3.3 CV Drive Shaft
5 China’s Import and Export of Drive Shaft
5.1 Import
5.1.1 Import Size
5.1.2 Import by Region
5.2 Export
5.2.1 Export Size
5.2.2 Export by Region
6 Major Chinese Companies
6.1 WanxiangQianchao Co., Ltd.
6.1.1 Profile
6.1.2 Operation
6.1.3 Operating Revenue Structure
6.1.4 Gross Margin
6.1.5 R&D Center
6.1.6 Drive Shaft
6.1.7 Major Customers
6.1.8 Major Suppliers
6.2 Shanghai GKN Drive System Co., Ltd
6.2.1 Profile
6.2.2 Operation
6.2.3 Output and Sales Volume of Drive Shaft
6.2.4 Subsidiaries
6.2.5 Production Base
6.3 XuchangYuandong Drive Shaft Co., Ltd.
6.3.1 Profile
6.3.2 Operation
6.3.3 Operating Revenue Structure
6.3.4 Gross Margin
6.3.5 Subsidiaries
6.3.6 Drive Shaft
6.3.7 Major Customers
6.3.8 Major Suppliers
6.3.9 R&D
6.3.10 Key Projects
6.4 Hebei Yulong Drive Shaft Co., Ltd.
6.4.1 Profile
6.4.2 Output and Sales Volume of Drive Shaft
6.4.3 Major Customers
6.5 FAWER Automotive Parts Limited Company
6.5.1 Profile
6.5.2 Operation
6.5.3 Operating Revenue Structure
6.5.4 Gross Margin
6.5.5 R&D Center
6.5.6 Drive Shaft
6.5.7 Major Customers
6.5.8 Major Suppliers
6.5.9 Production Base
6.6 LuoheShilinXinyuan Auto Parts Co., Ltd.
6.7 Shanghai Yaoyuan Crop.
7 Major Foreign Players
7.1 DANA
7.1.1 Profile
7.1.2 Operation
7.1.3 Revenue Structure
7.1.4 Gross Margin
7.1.5 R & D Base
7.1.6 Major Customers
7.1.7 Production Base
7.1.8 DANA China
7.2 GKN
7.2.1 Profile
7.2.2 Operation
7.2.3 Revenue Structure
7.2.4 Headcount
7.2.5 Drive Shaft
7.2.6 GKN China
7.2.7 Auto Models Supported
7.3 AAM
7.3.1 Profile
7.3.2 Operation
7.3.3 Revenue Structure
7.3.4 Gross Margin
7.3.5 R&D Base
7.3.6 Major Customers
7.3.7 Production Base
7.3.8 AAM China
7.4 Magna
7.4.1 Profile
7.4.2 Operation
7.4.3 Revenue Structure
7.4.4 Gross Margin
7.4.5 Major Customers
7.4.6 Production Base
7.4.7 Magna China
7.5 NTN
7.5.1 Profile
7.5.2 Operation
7.5.3 R&D
7.5.4 Production Base
7.5.5 Drive Shaft
7.5.6 NTN China
7.6 IFA Rotorion
China’s Aggregate GDP and YoY Growth, 2000-2015
China’s GDP Growth by Industry, 2001-2015
China’s Fixed Asset Investment and YoY Growth, 2013-2015
China’s Fixed Asset Investment and YoY Growth by Industry, 2013-2015
Real Estate Development’s Share of Fixed Asset Investment in China, 2013-2015
China’s Investment for Real Estate Development and YoY Growth, 2013-2015
China’s Imports, Exports and YoY Growth, 2013-2015
China’s Total Retail Sales of Consumer Goods and YoY Growth, 2013-2015
Classification of Drive Shaft
Structure of Drive Shaft Industry Chain
Global Automobile Output, 2006-2018E
Global Top20 Automobile Producing Countries, 2007-2014
Number of Chinese Carmakers and YoY Growth, 2003-2015
Revenue and YoY Growth of China Automobile Manufacturing Industry, 2003-2015
Total Profit and YoY Growth of China Automobile Manufacturing Industry, 2003-2015
China’s Automobile Output, 2007-2015
China’s Automobile Output by Model, 2007-2015
China’s Output of Passenger Vehicles and Market Segments, 2005-2015
China’s Bus Output by Model, 2005-2015
China’s Truck Output by Model, 2005-2015
Sales Volume of Automotive Drive Shaft and Relevant Products Worldwide, 2007-2018E
Sales of Automotive Drive Shaft and Relevant Products Worldwide, 2007-2018E
Market Share of Dynamic System Worldwide, 2012
Number of Chinese Drive Shaft Companies, 2008-2013
Output of Major Chinese Drive Shaft Companies, 2011-2013
Sales Volume of Major Chinese Drive Shaft Companies, 2011-2013
Share of Demand for Drive Shaft from Passenger Vehicle and Commercial Vehicle in China, 2011-2014
China’s Demand for Non-CV Drive Shaft, 2011-2014
China’s New Demand for Drive Shaft for Commercial Vehicle, 2011-2014
AM Demand for Non-CV Drive Shaft for Commercial Vehicle in China, 2011-2014
China’s Demand for Drive Shaft for Commercial Vehicle, 2011-2014
China’s New Demand for Drive Shaft for Construction Machinery, 2011-2014
AM Demand for Drive Shaft for Construction Machinery in China, 2011-2014
China’s Demand for Drive Shaft for Construction Machinery, 2011-2014
China’s New Demand for CV Drive Shaft for Passenger Vehicle, 2011-2014
AM Demand for CV Drive Shaft for Passenger Vehicle in China, 2011-2014
China’s Demand for CV Drive Shaft for Passenger Vehicle, 2011-2014
China’s Import Volume and Value of Automotive Drive Shaft, 2009-2015
China’s Automotive Drive Shaft Imports, 2009-2015
Top 10 Chinese Regions by Automotive Drive Shaft Import Volume, 2009-2015
China's Automotive Drive Shaft Import Value, 2009-2015
Top 10 Chinese Regions by Automotive Drive Shaft Import Value, 2009-2015
China’s Export Volume and Value of Automotive Drive Shaft, 2009-2015
China’s Automotive Drive Shaft Exports, 2009-2015
Top 10 Chinese Regions by Automotive Drive Shaft Export Volume, 2009-2015
China's Automotive Drive Shaft Export Value, 2009-2015
Top 10 Chinese Regions by Automotive Drive Shaft Export Value, 2009-2015
Revenue and YoY Growth of WanxiangQianchao, 2010-2015
Revenue and YoY Growth of WanxiangQianchao by Product, 2009-2013
Revenue and YoY Growth of WanxiangQianchao by Region, 2010-2014
Revenue Structure of WanxiangQianchao by Channel, 2013-2014
Overall Gross Margin of WanxiangQianchao, 2010-2014
Gross Margin of WanxiangQianchao by Product and Region, 2010-2014
R&D Costs and % of Total Revenue of WanxiangQianchao, 2012-2014
Output, Sales Volume and Inventory of WanxiangQianchao, 2012-2014
WanxiangQianchao’s Revenue from Top5 Customers and % of Total Revenue, 2013-2014
WanxiangQianchao’s Procurement from Top5 Suppliers and % of Total Procurement, 2013-2014
Investment Structure of Shanghai GKN Drive System
Revenue and YoY Growth of Shanghai GKN Drive System, 2010-2013
Drive Shaft Output of Shanghai GKN Drive System, 2009-2013
Subsidiaries of Shanghai GKN Drive System
Production Bases of Shanghai GKN Drive System
Revenue and YoY Growth of XuchangYuandong Drive Shaft, 2009-2015
Revenue Breakdown of XuchangYuandong Drive Shaft by Product and Region, 2009-2014
Operating Costs of XuchangYuandong Drive Shaft by Product and Region, 2009-2014
Gross Margin of XuchangYuandong Drive Shaft by Product, 2009-2014
Joint-stock and Holding Companies, Shareholding Ratio and Primary Businesses of XuchangYuandong Drive Shaft, 2014
Output and Sales Volume of XuchangYuandong Drive Shaft, 2012-2014
XuchangYuandong Drive Shaft’s Revenue from Top5 Customers and % of Total Revenue, 2014
XuchangYuandong Drive Shaft’s Procurement from Top5 Suppliers and % of Total Procurement
R&D Costs of XuchangYuandong Drive Shaft, 2013-2014
Output and Sales Volume of Hebei Yulong Drive Shaft, 2011-2013
Customers of Hebei Yulong Drive Shaft
Revenue and YoY Growth of FAWER Automotive Parts, 2009-2015
Revenue and YoY Growth of FAWER Automotive Parts by Product, 2013-2014
Gross Margin of FAWER Automotive Parts by Product, 2013-2014
R&D Costs of FAWER Automotive Parts and % of Total Revenue, 2013-2014
R&D Projects of FAWER Automotive Parts, 2014
FAWER Automotive Parts
Output and Sales Volume of FAWER Automotive Parts’ Main Products, 2013-2014
FAWER Automotive Parts’ Revenue from Top5 Customers and % of Total Revenue, 2013-2014
FAWER Automotive Parts’ Procurement from Top5 Suppliers and % of Total Procurement, 2013-2014
Products of FAWER Automotive Parts’ Major Branch Companies
Major Subsidiaries and Joint Ventures of FAWER Automotive Parts, 2014
Revenue and YoY Growth of DANA, 2009-2015
Classification of and Models Supported by DANA’s Products
Revenue Breakdown of DANA by Product, 2009-2014
Revenue Structure of DANA by Product, 2009-2014
Revenue Breakdown of DANA by Region, 2009-2014
Revenue Structure of DANA by Region, 2009-2014
Forecast of DANA’s Performance by Region, 2015
Gross Margin of DANA, 2009-2014
R&D Costs of DANA and % of Total Revenue, 2011-2014
Markets and Major Customers of DANA
Share of DANA’s Major Customers, 2014
Regional Production Bases of DANA, 2014
Main Business Segments of GKN, 2014
Global Production Bases of GKN
Revenue and YoY Growth of GKN, 2013-2014
Revenue Breakdown of GKN by Product/Segment, 2012-2014
Revenue Structure of GKN by Region, 2014
Employees and YoY Growth of GKN, 2009-2014
Global Employees of GKN, 2014
Revenue of GKN Driveline Segment, 2013-2014
Revenue Breakdown of GKN Driveline Segment by Business, 2014
Revenue of GKN Driveline Segment by Region, 2014
Production Bases of GKN Driveline, 2014
Major Customers of GKN Driveline, 2014
Main Factories for AWD Systems of GKN
Revenue and YoY Growth of AAM, 2009-2015
Revenue Structure of AAM by Product, 2009-2014
Revenue Breakdown of AAM by Region, 2009-2014
Consolidated Gross Margin of AAM, 2011-2014
R&D Costs of AAM, 2011-2014
Major Customers’ Share of Total Revenue of AAM, 2011-2014
Production Bases, Locations and Main Businesses of AAM
Revenue and YoY Growth of Magna, 2009-2014
Net Income of Magna, 2010-2014
Revenue Breakdown of Magna by Product, 2009-2014
Revenue Structure of Magna by Product, 2009-2014
Revenue Breakdown of Magna by Region, 2009-2014
Consolidated Gross Margin of Magna, 2009-2014
Revenue Breakdown of Magna by Customer, 2009-2014
Revenue Structure of Magna by Customer, 2009-2014
Revenue and Financial Indexes of NTN, FY2010-FY2015
Revenue Breakdown of NTN by Business/Region, FY2013-FY2015
Revenue Breakdown of NTN’s After-sales Service Business by Region, FY2011-FY2015
Revenue Breakdown of NTN’s Automotive Business by Region, FY2011-FY2015
R&D Costs of NTN, FY2012-FY2014
NTN’s Production and Marketing Network in China
Major Customers of Guangzhou NTN-Yulong Drivetrain, 2013
Global and China Leading Tier1 Suppliers’ Intelligent Cockpit Business Research Report, 2022 (II)
Tier1 Intelligent Cockpit Research: The mass production of innovative cockpits gathers pace, and penetration of new technologies is on a rapid riseGlobal OEMs and Tier 1 suppliers are racing for the i...
Global and China Leading Tier1 Suppliers’ Intelligent Cockpit Business Research Report, 2022 (I)
Tier1 Intelligent Cockpit Research: The mass production of innovative cockpits gathers pace, and penetration of new technologies is on a rapid riseGlobal OEMs and Tier 1 suppliers are racing for the i...
China Commercial Vehicle Intelligent Cockpit Industry Report 2021
Research on Intelligent Cockpits of Commercial Vehicles: Heading for Large Screens, Voice Interaction, Entertainment and Life
Following AD/ADAS functions, the intelligent configuration of the cockpit...
Automotive Ultra Wide Band (UWB) Industry Report, 2022
UWB got initially utilized in the military field, and began to be commercially applied after the release of criteria for UWB commercialization in 2002. In 2019, Car Connectivity Consortium (CCC) liste...
China Automotive Distribution and Aftermarket Industry Report, 2022-2027
Since the introduction of 4S store model into China at the end of 20th century, China's authorized dealer system has gradually developed from a single-store-based mode to a group-based mode, and from ...
Global and China Skateboard Chassis Industry Report, 2021-2022
Research into skateboard chassis: where to sell, how to sell and to whom it is sold
Rivian, a new carmaker based on skateboard chassis, is quite popular in the market and becomes the focus of the aut...
Emerging Automakers Strategy Research Report, 2022--NIO
Research on emerging carmaking strategies: no new cars in 2021, 3 new cars in 2022, can NIO make its renaissance?
The delivery of ET7 is imminent, and the sluggish sales situation is expected to fade...
Automotive and 5G Industry Integration Development Report, 2022
Research on integration of vehicle and 5G: OEMs rush into mass production of 5G models whose sales may reach 3.68 million units in 2025
By the end of 2021, China had built and opened in excess of 1.3...
China Automotive Finance Industry Report, 2022-2030
Auto finance is lucrative with the highest profit margin in the international automobile industry chain, contributing to roughly 23% of the global automobile industry profits. Yet, auto finance only h...
Global and China Power Battery Management System (BMS) Industry Report, 2022-2026
1. Robust demand from new energy vehicle spurs BMS market to boom
New energy vehicle sales have been growing rapidly worldwide over the recent years, reaching 6.5 million units with a year-on-year up...
ADAS/AD Chip Industry Research Report, 2022
Autonomous driving chip research: In addition to computing power, core IP, software stacks, AI training platforms, etc. are becoming more and more importantL2.5 and L2.9 have achieved mass production ...
Automotive Sensor Chip Industry Research Report, 2022
Sensor Chip Research: Automotive Sensors Have Entered a Technology Iteration Cycle, and Opportunities for Localization of Chips Are Coming Automotive sensor chips can obtain external environment ...
Automotive Cloud Service Platform Industry Report, 2021-2022
Research on Automotive Cloud Services: Based on 5ABCD, cloud services run through the R&D, production, sale, management and services of automakersWith the development of intelligent connectivity, ...
Global and China Cobalt Industry Report, 2021-2026
As a very rare metal and an important strategic resource for a country, cobalt gets typically utilized in battery materials, super heat-resistant alloys, tool steels, cemented carbides, and magnetic m...
Automotive Event Data Recorder (EDR) Industry Report, 2022
An event data recorder (EDR), sometimes referred to informally as an automotive black box, is a device or a system installed in vehicle to monitor, collect and record technical vehicle data and occupa...
Commercial Vehicle ADAS Industry Report, 2021
ResearchInChina has published the "Commercial Vehicle ADAS Industry Report, 2021", focusing on policy climate, ADAS installations, suppliers, etc., and with a deep dive into the prospects of Chinese c...
Automotive High-precision Positioning Research Report, 2022
High-precision Positioning Research: from L2+ to L3, high-precision integrated navigation and positioning will become the standard
With the development and progress of the autonomous driving industry...
China Around View System (AVS) Suppliers and Technology Trends Report, 2021 –Joint Venture Automakers
Research into JV automakers’ around view system: large-scale implementation of AVP is round the corner, and AVS vendors are energetically pushing ahead with parking fusion solution.
During January to...