China Air Transport and Airport Industry Report, 2015-2018
-
Mar.2015
- Hard Copy
- USD
$2,400
-
- Pages:110
- Single User License
(PDF Unprintable)
- USD
$2,200
-
- Code:
LMX062
- Enterprise-wide License
(PDF Printable & Editable)
- USD
$3,500
-
- Hard Copy + Single User License
- USD
$2,600
-
Since 2014, despite negative influence from slower economic growth at home and abroad and high-speed railway on Chinese aviation market demand, China’s civil aviation passenger throughput still kept relatively rapid growth driven by tourist’s leisure demand, and cargo & mail throughput rallied slightly driven by a pickup in exports. In the first eleven months of 2014, China’s total civil aviation turnover, passenger turnover, and cargo & mail turnover reached 68.385 billion ton-kilometers, 580.181 billion passenger-kilometers, and 16.874 billion ton-kilometers, a year-on-year increase of 11.1%, 11.60%, and 8.8%, respectively.
However, the airlines suffered heavy exchange losses due to yuan depreciation against dollar. In the first three quarters of 2014, four big airlines all saw sharp decline in net income, with China Eastern Airlines falling the hardest, at 48.94%. Compared with significant drop in profits of the four big airlines since 2010, Spring Airlines, a representative of budget airlines, has enjoyed continuous increase in revenue and net income ever since 2011, with the latter recording a growth of 4.17% in the first three quarters of 2014.
Revenue and Net Income of Major China Airlines in the First Three Quarters of 2014 (Unit: RMB mln)
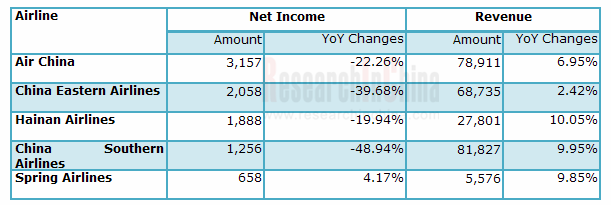
Source: Companies Mentioned Above, ResearchInChina
To improve performance, the airlines in China have sought to make progress in two aspects since 2013: accelerate the opening up of international and regional routes; speed to expand into low-cost aviation industry.
Actively opening up new routes: In 2014, Air China added 12 routes (4 domestic ones and 8 international ones), totaling 33 international routes from 2012. In the same year, China Southern Airlines opened 9 new international routes, bringing the total newly-added international routes to 26 since 2012.
Speeding layout in low-cost aviation industry: In Mar. 2013, China West Air announced to transform into a low-cost carrier; in Jun. 2013, Hong Kong Express Airways announced its intention to transform into a low-cost carrier; on Jul. 2014, China Eastern Airlines announced its subsidiary China United Airlines to convert into a low-cost airline; on Jan. 21, 2015, Spring Airlines got its shares listed on the Shanghai Stock Exchange, becoming the first listed low-cost airline in China.
China Air Transport and Airport Industry Report, 2015-2018 focuses on the following:
 Development environment for air transport industry in China, covering economic environment, policy environment, and social environment;
Operation status of air transport industry and low-cost aviation market in China;
Operation status of airport transportation in China, including passenger throughput, cargo & mail throughput, and airplane takeoffs and landings;
Overall economic results of air transport industry in China, encompassing revenues and total profits of companies in the industry;
16 major airlines in China, including financial situation, transport capacity, carrying capacity, load factor, development strategy, and performance forecast;
15 major transport airports in China, including financial situation, three production index, and performance forecast;
Forecast on main data of China’s air transport industry for 2015-2018.
Preface
1. Development Environment for China Air Transport Industry
1.1 Economic Environment
1.2 Policy Environment
1.3 Social Environment
2. Operation and Development Status of China Air Transport Industry
2.1 Operation Indicators
2.1.1 Transport Capacity
2.1.2 Traffic Turnover
2.1.3 Traffic Volume
2.1.4 Traffic Efficiency
2.2 Low-Cost Aviation Market
2.2.1 Development Process
2.2.2 Development Status
2.2.3 Future Development
3. Operation of China Airport Transportation Industry
3.1 Number of Destinations & Airports
3.2 Passenger Throughput
3.3 Cargo & Mail Throughput
3.4 Aircraft Movements
4. Economic Benefits of China Air Transport and Airport Industry
4.1 Overall
4.2 Industry Segments
5. Operation of Major Chinese Airlines
5.1 Competition Pattern
5.1.1 Performance
5.1.2 Transport Capacity
5.1.3 Traffic Volume
5.1.4 Passenger Load Factor
5.2 China Southern Airlines
5.2.1 Profile
5.2.2 Operation
5.2.3 Transport Capacity
5.2.4 Carrying Capacity
5.2.5 Load Factor
5.2.6 Strategy Transition
5.2.7 Performance Forecast
5.3 China Eastern Airlines
5.3.1 Profile
5.3.2 Operation
5.3.3 Transport Capacity
5.3.4 Carrying Capacity
5.3.5 Load Factor
5.3.6 Strategy Transition
5.3.7 Performance Forecast
5.4 Air China
5.4.1 Profile
5.4.2 Operation
5.4.3 Transport Capacity
5.4.4 Carrying Capacity
5.4.5 Load Factor
5.4.6 Development Strategy
5.4.7 Performance Forecast
5.5 Hainan Airlines
5.5.1 Profile
5.5.2 Operation
5.5.3 Transport Capacity
5.5.4 Carrying Capacity
5.5.5 Load Factor
5.5.6 Performance Forecast
5.6 Cathay Pacific Airways
5.6.1 Profile
5.6.2 Operation
5.6.3 Transport Capacity
5.6.4 Carrying Capacity
5.6.5 Load Factor
5.6.6 Performance Forecast
5.7 Shandong Airlines
5.7.1 Profile
5.7.2 Operation
5.7.3 Transport Capacity
5.7.4 Carrying Capacity
5.7.5 Load Factor
5.7.6 Performance Forecast
5.8 Spring Airlines
5.8.1 Profile
5.8.2 Operation
5.8.3 Transport Capacity
5.8.4 Carrying Capacity
5.8.5 Load Factor
5.8.6 Fund-raising Projects
5.9 Juneyao Airlines
5.9.1 Profile
5.9.2 Operation
5.9.3 Transport Capacity
5.9.4 Carrying Capacity
5.9.5 Load Factor
5.9.6 Strategy
5.10 Shenzhen Airlines
5.10.1 Profile
5.10.2 Operation
5.10.3 Transport Capacity
5.10.4 Carrying Capacity
5.10.5 Load Factor
5.11 Xiamen Airlines
5.11.1 Profile
5.11.2 Operation
5.11.3 Transport Capacity
5.11.4 Carrying Capacity
5.11.5 Load Factor
5.12 Sichuan Airlines
5.13 China Express
5.14 China United Airlines
5.15 China Postal Airlines
5.16 China Cargo Airlines
5.17 Okay Airways
6. Operation of Major Chinese Airports
6.1 Competition Pattern
6.2 Beijing Capital International Airport
6.2.1 Profile
6.2.2 Financial Position
6.2.3 Production Index
6.2.4 Performance Forecast
6.3 Shanghai Airport
6.3.1 Profile
6.3.2 Financial Position
6.3.3 Production Index
6.3.4 Performance Forecast
6.4 Baiyun Airport
6.4.1 Profile
6.4.2 Financial Position
6.4.3 Production Index
6.4.4 Performance Forecast
6.5 Shenzhen Airport
6.5.1 Profile
6.5.2 Financial Position
6.5.3 Production Index
6.5.4 Performance Forecast
6.6 Chengdu Shuangliu International Airport
6.7 Kunming Changshui International Airport
6.8 Xi’an Xianyang International Airport
6.9 Chongqing Jiangbei International Airport
6.10 Hangzhou Xiaoshan International Airport
6.11 Xiamen Gaoqi International Airport
6.12 Changsha Huanghua International Airport
6.13 Nanjing Lukou International Airport
6.14 Wuhan Tianhe International Airport
6.15 Urumqi International Airport
6.16 Qingdao International Airport
7. Summary and Forecast for China Air Transport and Airport Industry
7.1 Digital Civil Aviation 2014
7.2 Development Forecast
7.2.1 Trends
7.2.2 Data Forecast
Fluctuation of China Civil Aviation RPK around GDP Growth Rate, 1991-2014
Laws, Regulations, and Policies Concerning China Air Transport Industry, 2011-2015
Urban Household’s Per Capita Transportation Communication Expense in China, 1985-2013
High Speed Rail VS Civil Aviation
Number of China Civil Aviation Aircrafts, 2004-2013
Number of Transport Aircrafts in China Civil Aviation Industry, 2006-2013
Number of China Civil Aviation Airlines, 2004-2013
China Civil Aviation Turnover and YoY Growth, 2006-2014
China Civil Aviation Passenger Turnover and YoY Growth, 2007-2014
China Civil Aviation Cargo & Mail Turnover and YoY Growth, 2007-2014
China Civil Aviation Turnover (by Air Route), 2006-2014
China Civil Aviation Passenger Traffic Volume and YoY Growth, 2007-2014
China Civil Aviation Passenger Traffic Volume (by Air Route), 2010-2014
China Civil Aviation Cargo & Mail Traffic Volume and YoY Growth, 2006-2014
China Civil Aviation Cargo & Mail Traffic Volume (by Air Route), 2010-2014
Daily Utilization Rate of China Civil Aviation Aircrafts, 2009-2014
Passenger Load Factor and Overall Load Factor of China Civil Aviation Industry, 2010-2014
Development Course of China Low-Cost Aviation Industry, 2003-2015
Global Low-Cost Aviation Market Share, 2004-2014
Number and Market Share of Low-Cost Airlines in the World (by Region), 2014
Passenger Transport Volume of Global Low-Cost Airlines (by Region), 2014
Development Difficulties of Low-Cost Airlines in China
Introduction of Low-Cost Airlines in China
Layout of Foreign Low-Cost Airlines in China
Low-Cost Airline Share Changes in the World’s Major Markets, 2007-2014
Low-Cost Aviation VS High Speed Railway
Number of Civil Aviation Destinations and Airports in China, 2007-2013
Number of Transport Airports in China (by Region), 2013
Passenger Throughput and YoY Growth of Transport Airports in China, 2007-2014
Passenger Throughput of Transport Airports in China (by Air Route), 2010-2013
Number of Transports with Passenger Throughput Exceeding 1 Million Person-times in China, 2013
Regional Distribution of China’s Passenger Throughput, 2013
Cargo & Mail Throughput and YoY Growth of Transport Airports in China, 2007-2014
Cargo & Mail Throughput of Transport Airports in China (by Air Route), 2010-2013
Regional Distribution of China’s Cargo & Mail Throughput, 2013
Aircraft Movements and YoY Growth of Airports in China, 2007-2014
Revenue and Total Profit of Civil Aviation Enterprises in China, 2009-2014
Structure of Revenue and Total Profit of China Civil Aviation Industry, 2013
Revenue and Total Profit of Airlines in China Civil Aviation Industry, 2009-2013
Revenue and Total Profit of Airports in China Civil Aviation Industry, 2009-2013
Airlines Ranking (by Net Income) in China, Q1-Q3, 2014
Airlines Ranking (by Revenue) in China, Q1-Q3, 2014
Airlines Ranking (by Number of Aircraft Ownership) in China, H1 2014
Key Chinese Airlines’ Three Capacity Indices, 2014
Key Chinese Airlines’ Traffic Volume, 2014
Key Chinese Airlines’ Passenger Load Factors, 2014
Revenue and Net Income of China Southern Airlines, 2009-2014
Structure of Main Business Cost of China Southern Airlines, H1 2014
Number of Aircraft Ownership of China Southern Airlines, 2009-2014
Three Capacity Indices of China Southern Airlines, 2008-2014
Carrying Capacity of China Southern Airlines, 2008-2014
Structure of Passenger Traffic Volume of China Southern Airlines, 2010-2014
Overall Load Factor of China Southern Airlines, 2008-2014
Strategy Transition of China Southern Airlines
Revenue and Net Income of China Southern Airlines, 2015E-2018E
Revenue and Net Income of China Eastern Airlines, 2009-2014
Structure of Operating Cost of China Eastern Airlines, H1 2014
Number of Aircraft Ownership of China Eastern Airlines, 2009-2014
Capacity Situation of China Eastern Airlines, 2008-2014
Carrying Capacity of China Eastern Airlines, 2008-2014
Structure of Passenger Traffic Volume of China Eastern Airlines, 2010-2014
Overall Load Factor of China Eastern Airlines, 2008-2014
Revenue and Net Income of China Eastern Airlines, 2015E-2018E
Revenue and Net Income of Air China, 2009-2014
Structure of Operating Cost of Air China, H1 2014
Number of Aircraft Ownership of Air China, 2009-2014
Main Capacity Indices of Air China, 2008-2014
Carrying Capacity Indices of Air China, 2008-2014
Structure of Passenger Traffic Volume of Air China, 2009-2014
Overall Load Factor of Air China, 2008-2014
Revenue and Net Income of Air China, 2015E-2018E
Revenue and Net Income of Hainan Airlines, 2009-2014
Number of Aircraft Ownership of Hainan Airlines, 2009-2014
Capacity Indices of Hainan Airlines, 2009-2014
Capacity Indices of Hainan Airlines, 2014
Carrying Capacity Indices of Hainan Airlines, 2009-2014
Overall Load Factor of Hainan Airlines, 2008-2014
Overall Load Factor of Hainan Airlines, 2014
Revenue and Net Income of Hainan Airlines, 2015E-2018E
Flight Lines of Cathay Pacific Airways and Its Affiliated Companies
Revenue and Net Income of Cathay Pacific Airways, 2009-2014
Structure of Operating Expenses of Cathay Pacific Airways, H1 2014
Number of Aircraft Ownership of Cathay Pacific Airways, 2009-2014
Capacity Indices of Cathay Pacific Airways, 2007-2014
Carrying Capacity Indices of Cathay Pacific Airways, 2007-2014
RPK Structure of Cathay Pacific Airways (by Region), 2014
Overall Load Factor of Cathay Pacific Airways, 2007-2014
Revenue and Net Income of Cathay Pacific Airways, 2015E-2018E
Revenue and Net Income of Shandong Airlines, 2009-2014
Fleet Type of Shandong Airlines, H1 2014
Major Operating Indicators of Shandong Airlines, 2010-2014
Overall Load Factor of Shandong Airlines, 2012-2014
Revenue and Net Income of Shandong Airlines, 2015E-2018E
Introduction of Spring Airlines
Revenue and Net Income of Spring Airlines, 2011-2014
Number of Aircraft Ownership of Spring Airlines, 2011-2014
Flying Range of Spring Airlines’ Airbus A320
Capacity Indices of Spring Airlines, 2011-2015
Carrying Capacity Indices of Spring Airlines, 2011-2015
Overall Load Factor of Spring Airlines, 2011-2015E
Fund-raising Projects of Spring Airlines
Revenue and Net Income of Juneyao Airlines, 2011-2014
Revenue Structure of Juneyao Airlines (by Segment), 2011-2014
Number of Aircraft Ownership of Juneyao Airlines, 2011-2014
Aircraft Type of Juneyao Airlines, end-Jun 2014
Carrying Capacity of Juneyao Airlines, 2007-2014
Structure of Passenger Traffic Volume of Juneyao Airlines, 2011-2014
Passenger Load Factor of Juneyao Airlines, 2011-2014
Revenue and Net Income of Shenzhen Airlines, 2011-2014
Number of Aircraft Ownership of Shenzhen Airlines
Capacity Indices of Shenzhen Airlines, 2010-2014
Carrying Capacity Indices of Shenzhen Airlines, 2010-2014
Overall Load Factor of Shenzhen Airlines, 2010-2014
Total Revenue of Xiamen Airlines, 2002-2013
Total Profit of Xiamen Airlines, 2002-2013
Number of Aircraft Ownership of Xiamen Airlines, 2011-2014
Carrying Capacity Indices of Xiamen Airlines, 2009-2014
Overall Load Factor of Xiamen Airlines, 2011-2013
Main Financial Indicators of Sichuan Airlines, 2009-2013
Carrying Capacity of Sichuan Airlines, 2006-2014
Passenger Carrying Capacity of China Express, 2007-2014
Introduction of China United Airlines
Carrying Capacity of China United Airlines, 2006-2014
Carrying Capacity of China Postal Airlines, 2006-2013
Revenue and Net Income of China Cargo Airlines, 2012-2014
Carrying Capacity of China Cargo Airlines, 2006-2013
Number of Aircraft Ownership of Okay Airways, 2005-2015
Carrying Capacity of Okay Airways, 2006-2014
Three Major Indices of Main Airports in China, 2014
Revenue and Net Income of Beijing Capital International Airport, 2008-2014
Operating Expenses of Beijing Capital International Airport, H1 2014
Three Production Indicators of Beijing Capital International Airport, 2007-2014
Revenue and Net Income of Beijing Capital International Airport, 2015E-2018E
Revenue and Net Income of Shanghai Airport, 2009-2014
Structure of Operating Cost of Shanghai Airport, H1 2014
Three Production Indicators of Shanghai Pudong Airport, 2009-2014
Three Production Indicators of Shanghai Hongqiao Airport, 2009-2014
Revenue and Net Income of Shanghai Airport, 2015E-2018E
Revenue and Net Income of Baiyun Airport, 2008-2014
Three Production Indicators of Baiyun Airport, 2008-2014
Revenue and Net Income of Baiyun Airport, 2015E-2018E
Revenue and Net Income of Shenzhen Airport, 2009-2014
Three Production Indicators of Shenzhen Airport, 2007-2015
Revenue and Net Income of Shenzhen Airport, 2015E-2018E
Three Production Indicators of Chengdu Shuangliu International Airport, 2007-2014
Three Production Indicators of Kunming Changshui International Airport, 2007-2014
Three Production Indicators of Xi’an Xianyang International Airport, 2007-2014
Three Production Indicators of Chongqing Jiangbei International Airport, 2007-2014
Three Production Indicators of Hangzhou Xiaoshan International Airport, 2007-2014
Three Production Indicators of Xiamen Gaoqi International Airport, 2007-2014
Three Production Indicators of Changsha Huanghua International Airport, 2007-2014
Three Production Indicators of Nanjing Lukou International Airport, 2007-2014
Three Production Indicators of Wuhan Tianhe International Airport, 2007-2014
Three Production Indicators of Urumqi International Airport, 2007-2014
Three Production Indicators of Qingdao International Airport, 2009-2014
Main Operation Indicators in China’s Civil Aviation Transportation Industry, 2013-2014
Airports (Passenger Throughput >10 Million Person-times) in China, 2014
New International Airlines of Major Airline Companies in China, 2012-2014
Revenue and Total Profit of Civil Aviation Companies in China, 2015E-2018E
Traffic Turnover of China’s Civil Aviation, 2015E-2018E
Passenger Traffic Volume of China’s Civil Aviation, 2015E-2018E
Cargo & Mail Traffic Volume of China’s Civil Aviation, 2015E-2018E
China Cold Chain Logistics Industry Report, 2020-2026
The Chinese residents see a change in food consumption and there is a growing market demand for cold chain of food alongside the accelerating urbanization in China. Chinese governments at all levels b...
China Cold Chain Logistics Industry Report, 2019-2025
Cold chain logistics is developing apace in China as cold chain for food is increasingly needed due to the accelerating process of urbanization and the changes in residents’ diet structure, whilst loc...
China Bicycle Sharing Industry Report, 2017-2021
The sharing economy, including bicycle sharing, has flourished along with the spread of smartphone and a surge in mobile users. As an important part of urban slow/shared transport system, the bicycle ...
Global and China Third-party Logistics Industry Report, 2016-2020
Third-party logistics can not only help companies complete cargo movement but effectively reduce logistics costs and speed up cargo turnover, fully meeting their requirements on logistics quality. The...
China Express Delivery Industry Report, 2016
Thanks to the rapid growth in e-commerce industry, the online shopping habits of the Chinese consumers have been gradually developed and deepened. In 2015, the online shopping market sales reached RMB...
China Cold Chain Logistics Industry Report, 2016-2020
With the growth of China’s economy over the past decade, the residents’ food consumption structure has experienced constant adjustment, a situation that led to a rising demand for food cold chain. Mor...
China Express Delivery Industry Report, 2015
In 2014, China surpassed the United States to become the world's largest express delivery country for the first time in terms of workload. Since 2015, the industry has continued to maintain a rapid gr...
China Air Transport and Airport Industry Report, 2015-2018
Since 2014, despite negative influence from slower economic growth at home and abroad and high-speed railway on Chinese aviation market demand, China’s civil aviation passenger throughput still kept r...
China Cold Chain Logistics Industry Report, 2014-2017
Since Cold Chain Logistics Development Plan of Agricultural Products was introduced in 2010, China cold chain logistics industry has entered an unprecedented rapid development stage. In October 2014, ...
China Air Transport and Airport Industry Report, 2013-2016
In January-November 2013, China’s civil aviation industry completed total traffic turnover of 61.6 billion ton kilometers, up 10.3% YoY; passenger transport volume of 326 million people, up 11.0% YoY;...
China Express Delivery Industry Report, 2013-2016
Benefiting from the explosive growth of e-commerce, China express delivery industry has maintained rapid growth since 2013. From January to September of 2013, the express delivery enterprises with the...
China Cold Chain Logistics Industry Report, 2013
The 12th Five-Year Planning concerning cold chain logistics was issued in 2011 following the release of Farm Produce Cold Chain Logistics Development Planning by National Development and Reform Commis...
China Express Delivery Industry Report, 2012
Although the growth rate of global economy slows down in 2012, Chinese express delivery industry still maintains high-speed development. From January to October of 2012, the business revenue of expres...
China Air Transport and Airport Industry Report, 2011-2012
Impacted by the global economic slowdown, the total traffic growth of China’s civil aviation industry decelerated in 2011. The passenger traffic was 293.17 million person-times, a year-on-year increas...
China Special Freight Logistics Industry Report, 2011-2012
This report highlights the study of large goods and dangerous cargo logistics, and also analyzes the highly specialized logistics fields, such as IT logistics, pharmaceutical logistics and home applia...
China General Cargo Logistics Industry Report, 2011-2012
In China, the logistic cost is increasing these years. In 2007, the gross external logistic cost of China broke RMB4 trillion, while the figure in 2009 hit RMB6 trillion. In 2011, China’s external log...
Company Study of China Railway Tielong Container Logistics Co., Ltd, 2010-2012
China Railway Tielong Container Logistics Co., Ltd (CRT), set up in Feb.1993, has three business segments including railway freight & port approaching logistics, railway special container business, an...
China Express Delivery Industry Report, 2011
In July, 2011, in the “Twelfth Five-Year (2011-2015)” plan on the development of postal industry issued by State Post Bureau of the People’s Republic of China, the following “twelfth five-year” develo...