Global and China Third-party Logistics Industry Report, 2016-2020
-
Feb.2017
- Hard Copy
- USD
$2,400
-
- Pages:116
- Single User License
(PDF Unprintable)
- USD
$2,200
-
- Code:
ZHP054
- Enterprise-wide License
(PDF Printable & Editable)
- USD
$3,500
-
- Hard Copy + Single User License
- USD
$2,600
-
Third-party logistics can not only help companies complete cargo movement but effectively reduce logistics costs and speed up cargo turnover, fully meeting their requirements on logistics quality. Therefore, third-party logistics develops rapidly. In 2015, global third-party logistics market size hit USD721 billion, a YoY rise of 4.5%, occupying 8.2% of the logistics market size, and increased around USD35.9 billion in 2016, up to USD756.9 billion. In the future, by virtue of high efficiency and highly standardized operation, the third-party logistics market size will grow steadily, expectedly outstripping USD900 billion in 2020, with a share of nearly 10.0% in the logistics market size.
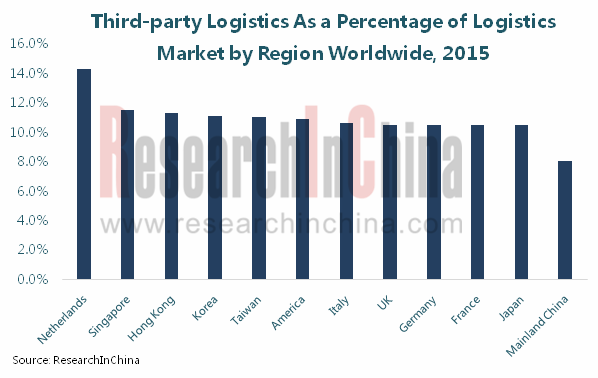
China is the world largest third-party logistics market. In 2015, its market size attained RMB1,065.2 billion or roughly USD171.8 billion (up 13.6% year on year), a 23.8% share in global market, and reached around RMB1,200 billion in 2016. Chinese (Mainland China) third-party logistics industry is still in its infancy, and lags behind the developed countries/regions by share in the whole logistic market (developed regions generally above 10.5%, Mainland China around 8.0%), leaving a large development space. Moreover, China’s regional trade imbalance also creates certain opportunities for the rapid development of third-party logistics. It is predicted that third-party logistics market size in China will see a CAGR of around 15.0% in 2016-2020.
Additionally with not a high market share, Chinese third-party logistics industry also has problems of insufficient demand and low-level demand at present, respectively due to relatively little use of third-party logistics by most traditional companies, and basic and conventional demand of companies which choose third-party logistics and their small demand for high value-added, comprehensive logistics service.
Development trend: to improve profitability and maximize operational efficiency, third-party logistics is heading towards largescale, informatization, asset-light and platform. In addition, as E-commerce in China gradually spreads to regions outside the first tier cities, third-party logistics companies make layout in the second- and third-tier cities accordingly.
Seen from competitive landscape, third-party logistics market has a low concentration rate, and the players compete fiercely. In 2015, CR10 of global third-party logistics industry was less than 20.0%, of which DHL Supply Chain & Global Forwarding with the largest market size only saw 4.1%; Sinotrans, China’s largest third-party logistics company, ranking eighth in the world, only witnessed a market share of 1.0%.
The report highlights the following:
 Overview of third-party logistics, including definition, classification, industry characteristics, industry chain, etc.;
Overview of global and Chinese logistics industry, including development overview, operation mode, market status, industry characteristics, development trend, etc.;
Overview of global third-party logistics, including development situation, market size, market structure, competitive pattern, etc.;
Overview of Chinese third-party logistics, including development overview, development environment, market size, market structure, competitive pattern, problems, development trend, etc.;
Overview of third-party logistics market segments like automotive and pharmaceutical, including market size, status quo, etc.;
Development of infrastructure (highway, railway, water carriage, aviation), transportation equipment (truck, railway wagon, etc.) and other intelligent logistics equipment;
Overview of 13 foreign, 9 Chinese third-party logistics companies, including operation, third-party logistics layout, etc..
1. Overview of Third-party Logistics
1.1 Definition
1.2 Classification
1.3 Industry Barriers
1.4 Industry Characteristics
1.5 Industry Chain
2. Logistics Industry
2.1 Development Overview
2.2 Operation Mode
2.3 Market Status
2.3.1 Global
2.3.2 China
2.4 Industry Characteristics
2.5 Development Trend
3. Global Third-party Logistics Industry
3.1 Development Overview
3.2 Market Size
3.3 Market Structure
3.4 Competitive Patten
4. Chinese Third-party Logistics Industry
4.1 Development Overview
4.2 Development Environment
4.2.1 Policy
4.2.2 Economy
4.3 Market Situation
4.3.1 Market Size
4.3.2 Market Structure
4.3.3 Competitive Patten
4.4 Problems
4.5 Development Trend
5. Third-party Logistics Market Segments
5.1 Automobile
5.1.1 Automotive Industry Scale
5.1.2 Status Quo of Third-party Logistics
5.2 Pharmaceutical
5.2.1 Pharmaceutical Industry Scale
5.2.2 Status Quo of Third-party Logistics
5.3 Cold-chain Third-party Logistics
6. Supporting Industries of Third-party Logistics
6.1 Infrastructure Construction
6.1.1 Highway
6.1.2 Railway
6.1.3 Water Transport
6.1.4 Aviation
6.2 Transportation Equipment Industry
6.2.1 Truck
6.2.2 Railway Wagon
6.2.3 Ship
6.2.4 Cargo Plane
6.3 Other Equipment
6.3.1 AGV
6.3.2 Automated Storage and Retrieval System (AS/RS)
7. Foreign Third-party Logistics Companies
7.1 DHL
7.1.1 Profile
7.1.2 Operation
7.1.3 Third-party Logistics Industry Layout
7.2 Kuehne + Nagel
7.2.1 Profile
7.2.2 Operation
7.2.3 Third-party Logistics Industry Layout
7.3 DB Schenker
7.3.1 Profile
7.3.2 Operation
7.3.3 Third-party Logistics Industry Layout
7.4 Nippon Express
7.4.1 Profile
7.4.2 Operation
7.4.3 Third-party Logistics Industry Layout
7.5 C.H Robinson
7.5.1 Profile
7.5.2 Operation
7.5.3 Third-party Logistics Industry Layout
7.6 UPS
7.6.1 Profile
7.6.2 Operation
7.6.3 Third-party Logistics Industry Layout
7.7 DSV
7.7.1 Profile
7.7.2 Operation
7.7.3 Third-party Logistics Industry Layout
7.8 CEVA
7.8.1 Profile
7.8.2 Operation
7.8.3 Third-party Logistics Industry Layout
7.9 Expeditors
7.9.1 Profile
7.9.2 Operation
7.9.3 Third-party Logistics Industry Layout
7.10 Others
7.10.1 Dachser
7.10.2 Panalpina
7.10.3 SNCF
7.10.4 Kintetsu
8. Chinese Third-party Logistics Companies
8.1 Sinotrans
8.1.1 Profile
8.1.2 Operation
8.1.3 Third-party Logistics Industry Layout
8.2 COSCO Shipping Logistics Co., Ltd.
8.2.1 Profile
8.2.2 Third-party Logistics Industry Layout
8.3 China Merchants Logistics Holding Co., Ltd.
8.3.1 Profile
8.3.2 Third-party Logistics Industry Layout
8.4 China National Materials Storage and Transportation Corporation
8.4.1 Profile
8.4.2 Main Subsidiary - CMST Development Co., Ltd.
8.5 Beijing Changjiu Logistics Co., Ltd.
8.5.1 Profile
8.5.2 Operation
8.5.3 Third-party Logistics Industry Layout
8.6 Others
8.6.1 China Shipping Logistics Co., Ltd.
8.6.2 Tianjin DTW Logistics Co., Ltd.
8.6.3 Qingdao Haier Logistics Co., Ltd.
8.6.4 Annto Logistics Co., Ltd.
Service Items of Third-party Logistics
Classification of Third-party Logistics Companies (by Cargo Loaded)
Classification of Third-party Logistics Companies
Difference between Third-party Logistics and Traditional Logistics
Risk Characteristics of Third-party Logistics Industry
Third-party Logistics Industry Chain
Express Delivery Mode
Warehouse Logistics Mode
Prologis Mode
Characteristics of Hardware Mode
Characteristics of E-commerce Mode
Global Logistics Market Size, 2006-2020E
Logistics Market Size as a Percentage of GDP by Region Worldwide, 2015
Logistics Cost as a Percentage of GDP by Country, 2015
Structure of Global Logistics Market Size by Region, 2015
Structure of Global Logistics Market Size by Country, 2015
Climate Index of Chinese Logistics Industry, 2011-2016
Chinese Logistics Companies by Type
Total Social Logistics in China, 2006-2020E
Total Cost of Social Logistics and YoY Growth in China, 2010-2017
Structure of Total Social Logistics in China by Product, 2010/2015
Main Information Technologies of Logistics Industry
Third-party Logistics as a Percentage of Logistics Scale Worldwide, 2010-2020E
Third-party Logistics as a Percentage of Logistics Scale by Region Worldwide, 2015
Third-party Logistics as a Percentage of Logistics Scale by Country/Region Worldwide, 2015
Risk Structure of Third-party Logistics in Asia-Pacific Region
Global Third-party Logistics Market Size, 2010-2020E
Third-party Logistics Market Size in the United States, 2010-2020E
Structure of Global Third-party Logistics Market Size by Region, 2015
Structure of Global Third-party Logistics Market Size by Country, 2015
Industry Scale of Third-party Logistics Segments in United States, 2015
Competitive Pattern of Global Third-party Logistics Market, 2015
Competitive Pattern of Third-party Logistics Market in United States, 2015
Chinese Third-party Logistics Companies by Type
Policies on Third-party Logistics Industry in China, 2015-2017
Regional Distribution of Chinese Financing Companies in Logistics Industry, 2014-2025E
Situation of Logistics Parks in Main Economic Areas in China, 2015
Third-party Logistics Revenue and YoY Growth in China, 2011-2020E
China’s Third-party Logistics Revenue as a Percentage of Global Total, 2011-2020E
Revenue Structure of Third-party Logistics in China by Region, 2015
Business Areas of Main Third-party Logistics Companies in China
Competitive Pattern of Third-party Logistics Market in China, 2015
Transport Capacity of Third-party Logistics Companies in China, 2016
Third-party Logistics as a Percentage of Logistics Market in China, 2015/2020E
Comparison among Different Types of Third-party Logistics
Global Automobile Output, 2010-2020E
Global Automobile Output Structure, 2010-2015
TOP 20 Countries by Automobile Output, 2015
Global Automobile Sales Volume, 2010-2020E
TOP 10 Countries by Automobile Sales Volume, 2010-2015
Automobile Sales Volume and YoY Growth in China, 2010-2020E
Sales Volume of Passenger Vehicles in China, 2010-2016
Sales Volume of Commercial Vehicles in China, 2010-2016
Main Automotive Logistics Businesses and Competition Situation
Development Course of Automotive Logistics in China
Classification of Automotive Logistics Companies in China
Operating Revenue of Main Automotive Logistics Companies in China, 2015
Main Automotive Third-party Logistics Companies Worldwide, 2015
Third-party Logistics Firms of Main Automakers Worldwide
Pharmaceutical Market Size in China, 2011-2020E
Growth Rate of Pharmaceutical Sales of Hospitals in China by Region, 2015
Cost Structure of Pharmaceutical Distribution in China by Channel, 2015
Main Pharmaceutical Third-party Logistics Companies Worldwide, 2015
Comparison between Chinese and Foreign Cold-chain Logistics Industry
Business Model of Cold-chain Logistics in China
Total Mileage and Density of Highways in China, 2011-2017
Structure of Total Mileage of Highways in China by Grade, 2015
Highway Freight Volume in China, 2010-2020E
Operating Mileage and Investment of Railways in China, 2011-2017
Railway Freight Volume in China, 2013-2020E
Water Transport Construction Investment in China, 2011-2016
Water Freight Volume, 2010-2020E
Navigable Length of Inland Waterways in China, 2013-2017
Structure of Navigable Length of Inland Waterways in China by Grade, 2015
Berthsof Ports in China by Tonnage, 2015
Berth (≥10kt) Structure in China, 2014-2015
Number of Civil Aviation Airports in China, 2011-2016
Air Cargo and Mail Throughput in China, 2011-2016
Air Cargo and Mail Throughput in China by Region, 2015
Air Freight Volume in China, 2010-2020E
Ownership of Trucks in China, 2010-2015
Output of Railway Wagons and YoY Growth in China, 2006-2016
Ownership of Ships for Water Transport in China, 2011-2016
Structure of Ships for Water Transport in China, 2015
Cargo Capacity of Three Major Airlines in China, 2010-2016
Transport Capacity Pricing Index of Civil Aviation Transportation in China, 2014-2016
Automated Logistics Equipment Market Size in China, 2012-2020E
Market Size Structure of Automated Logistics Equipment System in China by Equipment, 2013-2020E
New Automated Guided Vehicle (AGV) Products and YoY Growth Worldwide, 2011-2020E
Automated Guided Vehicle (AGV) Installs and YoY Growth in China, 2014-2020E
Automated Storage and Retrieval System (AS/RS) Market Size in China, 2013-2020E
Structure of Automated Storage and Retrieval System (AS/RS) Market Size in China by Sector, 2015
Branches of DHL
Operation of DHL, 2014-2016
Operation of DHL by Business, 2015-2016
Trade Structure of DHL by Region, 2015
Number of Clients of DHL in Third-party Logistics Segments, 2015
Revenue and Freight Volume of Global Forwarding Freight of DHL, 2015
Supply Chain Revenue Structure of DHL, 2015
Distribution of Employees of Kuehne + Nagel by Number, 2015-2016
Operation of Kuehne + Nagel, 2014-2016
Operation of Kuehne + Nagel by Business, 2015-2016
Revenue of Kuehne + Nagel by Region, 2014-2016
Kuehne + Nagel’s Revenue from Third-party Logistics Business, 2014-2016
Number of Clients of Kuehne + Nagel in Third-party Logistics Segments, 2015
Operation of DB Schenker, 2015
Transport Capacity of DB Schenker, 2015
Number of Clients of DB Schenker in Third-party Logistics Segments, 2015
Third-party Logistics Layout of DB Schenker in China
Global Presence of Nippon Express
Revenue and Net Income of Nippon Express, FY2010-FY2017
Development Plan of Nippon Express, FY2018
Revenue of Nippon Express by Business, FY2015-FY2016
Revenue Structure of Nippon Express by Region, FY2015-FY2016
Number of Clients of Nippon Express in Third-party Logistics Segments, 2015
Development Course of C.H. Robinson
Revenue and Net Income of C.H. Robinson, 2011-2015
Net Revenue of C.H. Robinson by Mode of Transport, 2011-2015
Total Revenue of C.H. Robinson by Region, 2013-2015
Two Information Platforms of C.H. Robinson
Major M&As of C.H. Robinson
Industry Structure of Logistics Clients of C.H. Robinson, 2015
Number of Clients of C.H. Robinson in Third-party Logistics Segments, 2015
Suppliers of C.H. Robinson by Logistics Capacity, 2015
Business Structure of UPS
Revenue and Net Income of UPS, 2013-2016
Revenue Structure of UPS by Business, 2015-2016
Revenue Structure of UPS by Region, 2015
Operation of Supply Chain & Freight Business of UPS, 2013-2015
Number of Clients of UPS in Third-party Logistics Segments, 2015
Overview of DSV
Revenue and Net Income of DSV, 2011-2016
Revenue Structure of DSV by Business, 2015-2016
Revenue Structure of DSV by Region, 2015
Global Presence of DSV and UTi
Number of Clients of UTi in Third-party Logistics Segments, 2015
Number of Clients of DSV in Third-party Logistics Segments, 2015
Distribution of CEVA’s Employees, 2015
Revenue and Net Income of CEVA, 2014-2016
Revenue Structure of CEVA by Business, 2015-2016
Revenue Structure of CEVA by Sector, 2015
Revenue Structure of CEVA by Region, 2015
CEVA’s Revenue from Third-party Logistics Business, 2014-2016
Number of Clients of CEVA in Third-party Logistics Segments, 2015
Revenue and Net Income of Expeditors, 2011-2016
Revenue Structure of Expeditors by Business, 2015-2016
Operation of Main Businesses of Expeditors, 2013-2015
Revenue Structure of Expeditors by Region, 2015
Net Revenue of Expeditors by Region, 2013-2015
Freight Volume of Expeditors, 2012-2015
Global Presence of Sinotrans
Revenue and Profits of Sinotrans, 2011-2016
Revenue Structure of Sinotrans by Business, 2014-2016
Logistics Operations of Sinotrans, 2014-2016
Global Presence of COSCO Shipping Logistics Co., Ltd.
Main Businesses of COSCO Shipping Logistics Co., Ltd.
Layout of China Merchants Logistics Holding Co., Ltd.
Fast Moving Consumer Goods (FMCG) Logistics Service Mode of China Merchants Logistics Holding Co., Ltd.
Established Transport Routes of China Merchants Logistics Holding Co., Ltd.
Intensive Management of China Merchants Logistics Holding Co., Ltd.
Visual Management of China Merchants Logistics Holding Co., Ltd.
Industrial Layout of China National Materials Storage and Transportation Corporation
China National Materials Storage and Transportation Corporation’s Revenue from Logistics Business, 2012-2016
Revenue and Net Income of CMST Development Co., Ltd., 2013-2016
Revenue Structure of CMST Development Co., Ltd. by Business, 2015-2016
Revenue and Net Income of Beijing Changjiu Logistics Co., Ltd., 2013-2016
Operating Automotive Business of Beijing Changjiu Logistics Co., Ltd., 2013-2015
Top 5 Passenger Vehicle Clients of Beijing Changjiu Logistics Co., Ltd., 2015
Business Layout of Beijing Changjiu Logistics Co., Ltd.
Business Mode of Beijing Changjiu Logistics Co., Ltd.
Revenue Structure of Beijing Changjiu Logistics Co., Ltd. by Mode of Transport, 2013-2015
Imported Complete Vehicle Transport Operation of Beijing Changjiu Logistics Co., Ltd., 2013-2015
Beijing Changjiu Logistics Co., Ltd.’s Revenue from Imported Complete Vehicle Transport Operation by Brand, 2013-2015
Shipments of Imported VW Brand Cars of Beijing Changjiu Logistics Co., Ltd., 2013-2015
Shipments of Imported Ford Brand Cars of Beijing Changjiu Logistics Co., Ltd., 2013-2015
Freight and Storage Capacity of Tianjin DTW Logistics Co., Ltd.
Freight and Distribution Capacity of Annto Logistics Co., Ltd., 2016
Presence of Self-built Distribution Center (DC) Warehouses of Annto Logistics Co., Ltd.
Presence of Distribution Centers (DC) of Annto Logistics Co., Ltd.
China Cold Chain Logistics Industry Report, 2020-2026
The Chinese residents see a change in food consumption and there is a growing market demand for cold chain of food alongside the accelerating urbanization in China. Chinese governments at all levels b...
China Cold Chain Logistics Industry Report, 2019-2025
Cold chain logistics is developing apace in China as cold chain for food is increasingly needed due to the accelerating process of urbanization and the changes in residents’ diet structure, whilst loc...
China Bicycle Sharing Industry Report, 2017-2021
The sharing economy, including bicycle sharing, has flourished along with the spread of smartphone and a surge in mobile users. As an important part of urban slow/shared transport system, the bicycle ...
Global and China Third-party Logistics Industry Report, 2016-2020
Third-party logistics can not only help companies complete cargo movement but effectively reduce logistics costs and speed up cargo turnover, fully meeting their requirements on logistics quality. The...
China Express Delivery Industry Report, 2016
Thanks to the rapid growth in e-commerce industry, the online shopping habits of the Chinese consumers have been gradually developed and deepened. In 2015, the online shopping market sales reached RMB...
China Cold Chain Logistics Industry Report, 2016-2020
With the growth of China’s economy over the past decade, the residents’ food consumption structure has experienced constant adjustment, a situation that led to a rising demand for food cold chain. Mor...
China Express Delivery Industry Report, 2015
In 2014, China surpassed the United States to become the world's largest express delivery country for the first time in terms of workload. Since 2015, the industry has continued to maintain a rapid gr...
China Air Transport and Airport Industry Report, 2015-2018
Since 2014, despite negative influence from slower economic growth at home and abroad and high-speed railway on Chinese aviation market demand, China’s civil aviation passenger throughput still kept r...
China Cold Chain Logistics Industry Report, 2014-2017
Since Cold Chain Logistics Development Plan of Agricultural Products was introduced in 2010, China cold chain logistics industry has entered an unprecedented rapid development stage. In October 2014, ...
China Air Transport and Airport Industry Report, 2013-2016
In January-November 2013, China’s civil aviation industry completed total traffic turnover of 61.6 billion ton kilometers, up 10.3% YoY; passenger transport volume of 326 million people, up 11.0% YoY;...
China Express Delivery Industry Report, 2013-2016
Benefiting from the explosive growth of e-commerce, China express delivery industry has maintained rapid growth since 2013. From January to September of 2013, the express delivery enterprises with the...
China Cold Chain Logistics Industry Report, 2013
The 12th Five-Year Planning concerning cold chain logistics was issued in 2011 following the release of Farm Produce Cold Chain Logistics Development Planning by National Development and Reform Commis...
China Express Delivery Industry Report, 2012
Although the growth rate of global economy slows down in 2012, Chinese express delivery industry still maintains high-speed development. From January to October of 2012, the business revenue of expres...
China Air Transport and Airport Industry Report, 2011-2012
Impacted by the global economic slowdown, the total traffic growth of China’s civil aviation industry decelerated in 2011. The passenger traffic was 293.17 million person-times, a year-on-year increas...
China Special Freight Logistics Industry Report, 2011-2012
This report highlights the study of large goods and dangerous cargo logistics, and also analyzes the highly specialized logistics fields, such as IT logistics, pharmaceutical logistics and home applia...
China General Cargo Logistics Industry Report, 2011-2012
In China, the logistic cost is increasing these years. In 2007, the gross external logistic cost of China broke RMB4 trillion, while the figure in 2009 hit RMB6 trillion. In 2011, China’s external log...
Company Study of China Railway Tielong Container Logistics Co., Ltd, 2010-2012
China Railway Tielong Container Logistics Co., Ltd (CRT), set up in Feb.1993, has three business segments including railway freight & port approaching logistics, railway special container business, an...
China Express Delivery Industry Report, 2011
In July, 2011, in the “Twelfth Five-Year (2011-2015)” plan on the development of postal industry issued by State Post Bureau of the People’s Republic of China, the following “twelfth five-year” develo...