China Electric Bus Industry Report, 2016-2020
-
Aug.2016
- Hard Copy
- USD
$2,400
-
- Pages:135
- Single User License
(PDF Unprintable)
- USD
$2,200
-
- Code:
SK004
- Enterprise-wide License
(PDF Printable & Editable)
- USD
$3,600
-
- Hard Copy + Single User License
- USD
$2,600
-
The report covers the following:
 Significance of promotion, status quo, international and domestic development trends of electric buses;
Mainstream technology roadmap, battery/motor/electronic control industry chain situation and trend of electric buses in China;
Main subsidies for purchasing (tax credits and fiscal subsidies) and using electric buses in China, as well as promotion policies across the country;
China’s electric bus output, sales volume and trends, as well as competition pattern, market share, sales forecast, investment and capacity of key players;
Technical level, production and marketing scale, capacity and development strategy of 12 major electric bus manufacturers in China.
In 2015, as a result of demand reduction, the Chinese bus market witnessed a 2.69% decline in output and a 1.90% drop in sales volume. The market is expected to keep falling during 2016-2018, followed by a modest uptick in 2019-2020.
The New Deal Supporting New Energy Vehicles released by the State Council in early 2016 specifically instructs the next-step target towards high and mid-end development and adopts the policy of “substituting subsidies with rewards” for power batteries. The growth of low-end electric buseswhich made up the majority of sales last year will be suppressed; besides, both decreased amount of subsidy and enhanced supervision on subsidy process will cause impact on low-end electric bus market.
China produced 112,296 electric buses in 2015, a year-on-year surge of 315%; 30,058 units in January-May 2016, a year-on-year increase of 81.18%. The overall growth has slowed compared with 2015 mainly because the introduction of the New Deal has greatly stimulated the market, giving rise to market consumption in advance before subsidy cuts. A gradual decrement trend will last over the next few years and eventually return to rationality.
In 2015, 88,248 pure electric buses were produced, accounting for 78.52%. In January-May 2016, 22,105 units were produced, including 4,400 units from Zhongtong Bus& Holding Co., Ltd., which as the dark horse of the pure electric bus market saw market share rising from 9.28% in 2015 to 19.90% in 2016.
In 2015, 24,048 plug-in hybrid electric buses were produced, registering 21.4%. Zhengzhou Yutong Bus Co., Ltd. with 6,348 units and 26.4% market share was far ahead. China has ended subsidies for ordinary hybrid electric buses since 2015, thus, most of the bus manufacturers have turned to production of plug-in hybrid electric buses.
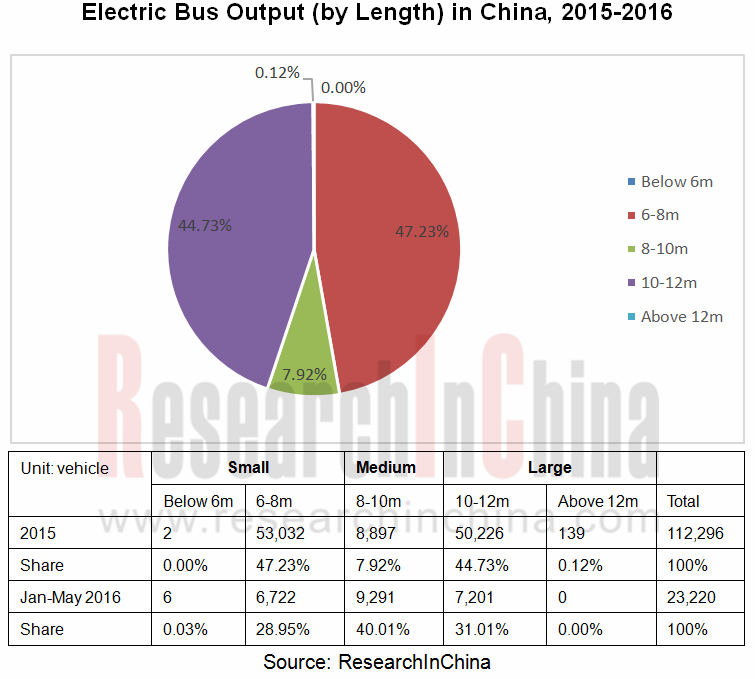
In 2015, small buses and large buses made major contribution to the Chinese electric bus market. Among them, small buses with output of 53,034 units boasted the highest share of 47.23% since city bus, special bus and short-tour bus maintained a good momentum of growth. And with the diversification of riding demand, community minibus and customized bus will also be the markets for small bus. In the future, small electric bus will usher in high-speed growth.
In 2015, Xiamen King Long Motor Group Co., Ltd. (including its three wholly-owned subsidiaries, namely King Long United Automotive Industry (Suzhou) Co., Ltd., Nanjing Golden Dragon Bus Co., Ltd and Xiamen Golden Dragon Bus Co., Ltd.), Zhengzhou Yutong Bus Co., Ltd., Zhongtong Bus &Holding Co., Ltd., BYD Company Limited and Dongfeng Motor Corporation as the top five electric bus manufacturers recorded total output of 50,357 units, accounting for 57.07%; the top ten manufacturers reported 59,956 units, making up 67.94%, indicating a high rate of market concentration.
Electric public transportation bus and tour bus will still be impetus for large bus growth in the future; medium bus growth is relatively weak; small bus is experiencing double-digit decreases in 2016 due to varying degrees of decline in subsidies for many models, the models not conforming to the requirements of national and local financial subsidies as well as intermingled manufacturing technologies, however, with growing demand from urban traffic and increasing density of battery energy, small bus and small electric bus will be the main driver of future growth.
1 Overview of Electric Bus
1.1 Significance of Popularization
1.2 Ecology & Economy
1.2.1Ecology
1.2.2 Economy
1.3 Status Quo and Trend of Promotion in China
1.3.1 Electric City Bus is Main Promotion Variety
1.3.2 Electric Highway Bus Will Be New Growth Point
1.3.3 Pure Electric City Bus Will Be Main Direction for Next Four Years
1.4 Status Quo and Trend of Promotion Abroad
1.4.1 Status Quo of Electric Bus Promotion
1.4.2 Trend of Electric Bus Technology
2 Industry Chain
2.1 Technology Roadmap
2.2 Battery
2.3 Motor & Controller
3 Industry Policies
3.1 Purchase Tax Reduction/Exemption Policies
3.2 Fiscal Subsidy Policies
3.2.1 Subsidies for Electric Buses 2014-2015
3.2.2 Subsidies for Electric Buses 2016-2020
3.2.3 Subsidies for Fuel Cell Buses
3.3 Fuel Subsidy Removal Policies
3.4 EV Promotion Policies
4 Chinese Electric Bus Market
4.1 Electric Bus Market
4.1.1 Overall Market
4.1.2 Enterprise Competition
4.1.3 Investment and Capacity
4.2 Total Bus Market
4.2.1 Overall Market
4.2.2 Enterprise Competition
5 Chinese Electric Bus Manufacturers
5.1 Zhengzhou Yutong Bus Co., Ltd.
5.1.1 Profile
5.1.2 Operation
5.1.3 Electric Bus Business
5.1.4 All Bus Business
5.1.5 Bus Capacity
5.1.6 Parts Support
5.2 BYD Company Limited
5.2.1 Profile
5.2.2 Operation
5.2.3 Electric Bus Business
5.2.4 Battery Business
5.2.5 All Electric Vehicle Business
5.3 Xiamen King Long Motor Group Co., Ltd.
5.3.1 Profile
5.3.2 Operation
5.3.3 Electric Bus Business
5.3.4 All Bus Business
5.3.5 Bus Capacity
5.4 Nanjing Golden Dragon Bus Co., Ltd
5.4.1 Profile
5.4.2 Electric Bus Business
5.5 Zhongtong Bus Holding Co., Ltd.
5.5.1 Profile
5.5.2 Operation
5.5.3 Electric Bus Business
5.5.4 All Bus Business
5.5.5 Bus Capacity
5.6 BeiqiFoton Motor Co., Ltd.
5.6.1 Profile
5.6.2 Operation
5.6.3 Electric Bus Business
5.6.4 All Bus Business
5.6.5 Bus Capacity
5.7 Shanghai Sunwin Bus Corporation
5.7.1 Profile
5.7.2 Electric Bus Business
5.7.3 All Bus Business
5.7.4 Bus Capacity
5.8 Hunan CRRC Times Electric Vehicle Co.,Ltd.
5.8.1 Profile
5.8.2 Operation
5.8.3 Electric Bus Business
5.8.4 Bus Capacity
5.9 Anhui Ankai Automobile Co., Ltd.
5.9.1 Profile
5.9.2 Operation
5.9.3 Electric Bus Business
5.9.4 All Bus Business
5.9.5 Bus Capacity
5.10 Young Man Bus Co., Ltd.
5.10.1 Profile
5.10.2 Electric Bus Business
5.10.3 All Bus Business
5.10.4 Bus Capacity
5.11 Chongqing Hengtong Bus Co., Ltd.
5.11.1 Profile
5.11.2 Operation
5.12.3 Electric Bus Business
5.12.4 All Bus Business
5.12.5 Bus Capacity
5.12 Wuzhoulong MotorsCo., Ltd.
5.12.1 Profile
5.12.2 Operation
5.12.3 Electric Bus Business
Ownership of City Buses in China, 2008-2014
Proportion of Urban Passenger Traffic in China
Vehicle Pollutant Emission
CO2 Emission per Km of Various Buses (g/km, vehicle)
Pollutant Emission of Various Buses inside City (Kg/year, vehicle)
Pollutant Emission of Various Buses outside City (Kg/year, vehicle)
Overall Pollutant Emission of Various Buses (Kg/year, vehicle)
Total Costs of Various Buses during Whole Life Cycle – before Subsidies
Total Costs of Various Buses during Whole Life Cycle – after Purchase Subsidies
Total Costs of Various Buses during Whole Life Cycle – after Purchase and Fuel Subsidies
Results of Comprehensive Comparison between Different Technology Roadmaps
Promotion of Electric Bus Worldwide (as of 2014)
Technical Sketch Map of Wireless Charging Bus
London Online Fast-Charging Electric Bus Network Planning for 2020
Buses’ and Private Cars’ Common Use of Vehicle Charging Infrastructure
Technical Parameters of Electric Buses with Different Technology Roadmaps
Electric Vehicle Battery, Motor, Electric Control Industry Chains
Requirements of Electric Vehicle on Performance of Battery and Battery System
Electric Bus Power Battery (by Technology Roadmap) Assembly Rate, Jan-May, 2016
Motor and Controller Supply Relationship of Major Electric Bus Enterprises
Catalogue of Vehicle Models Exempt from Purchase Tax in the First Eight Batches Issued by MIIT
Subsidy Standards for Electric Bus in China, 2014-2015 (Central Finance)
Subsidy Standards for Electric Bus in China, 2016 (Central Finance)
Subsidy Standards for Fuel Cell Vehicle in China, 2016
Subsidy Standards for Energy-saving and New Energy Buses in Operation (2015-2019)
Electric Vehicle Promotion Campaign and Completion in Cities (Cluster) China, 2013-2015
Electric Vehicle Promotion Campaign (Public Transport and Private Consumption) in China, 2014-2015
Promotion Quantity of Electric Vehicles in Cities (Cluster) China, 2015
Electric Bus Output in China, 2012-2020E
Electric Bus Output Proportion (by Power Type) in China, 2015
Electric Bus Output (by Power Type) in China, 2016, 1-6
Electric Bus Output Proportion (by Power Type) in China, 2016, 1-6
Electric Bus Output (by Length) in China, 2015
Electric Bus Output (by Purpose) in China, 2012-2020E
Electric Bus Sales Volume and Electrification Rate in China, 2009-2017E
Top 10 Manufacturers by Output of New Energy Buses in China, 2015
Top 10 Manufacturers by Output of New Energy Buses in China, Jan.-May, 2016
Output and Market Share (Top 10) of Battery Electric Bus Enterprises, 2015
Output and Market Share (Top 10) of Battery Electric Bus Enterprises in China, 2016, 1-5
Top 10 Manufacturers by Output of Plug-in Hybrid Electric Buses in China, 2015
Top 10 Manufacturers by Output of Plug-in Hybrid Electric Buses in China, Jan.-May, 2016
Sales Volume of Main Electric Bus Enterprises in China, 2012-2017E
Electric Bus Investments in China, 2009-2015
Bus Output (Including Bus and Bus Chassis) in China, 2015-2020E
Bus Sales Volume (Including Bus and Bus Chassis) in China, 2015-2020
Bus Sales Volume (by Length) in China, 2015-2020E
Ranking of Top 10 Enterprises by Large Bus Sales, 2015
Market Share of Top 10 Enterprises by Large Bus Sales in China, 2015
Ranking of Top 10 Enterprises by Large Bus Sales, 2016, 1-5
Market Share of Top 10 Enterprises by Large Bus Sales in China, 2016, 1-5
Large Bus Market Structure (by Purpose) in China, 2015
Ranking of Top 10 Enterprises by Medium Bus Sales, 2015
Market Share of Top 10 Enterprises by Medium Bus Sales in China, 2015
Ranking of Top 10 Enterprises by Medium Bus Sales, 2016, 1-5
Market Share of Top 10 Enterprises by Medium Bus Sales in China, 2016, 1-5
Medium Bus Market Structure (by Purpose) in China, 2014-2015
Ranking of Top 10 Enterprises by Small Bus Sales, 2015
Market Share of Top 10 Enterprises by Small Bus Sales in China, 2015
Ranking of Top 10 Enterprises by Small Bus Sales, 2016, 1-5
Market Share of Top 10 Enterprises by Small Bus Sales in China, 2016, 1-5
Equity Structure of Zhengzhou Yutong Bus, 2014
Operating Performance of Zhengzhou Yutong Bus, 2010-2016Q1
Revenue Breakdown (by Region) of Zhengzhou Yutong Bus, 2010-2015
R&D Expenditure of Zhengzhou Yutong Bus, 2011-2015
Performance Forecast of Zhengzhou Yutong Bus, 2016-2020E
Electric Bus Sales Volume of Zhengzhou Yutong Bus, 2011-2016
Sales Volume of New Energy Buses (by Type) of Zhengzhou Yutong Bus, 2015
Electric Bus Sales Proportion of Zhengzhou Yutong Bus, 2011-2015
Output (by Model) of Zhengzhou Yutong Bus, 2011-2016.5
Sales Volume (by Model) of Zhengzhou Yutong Bus, 2011-2016.5
Sales Volume (by Purpose) of Zhengzhou Yutong Bus, 2011-2015
Sales Proportion (by Purpose) of Zhengzhou Yutong Bus, 2011-2015
Capacity Layout (Including Electric Bus) of Zhengzhou Yutong Bus, 2016
Operating Performance of BYD, 2010-2016Q1
Revenue Structure (by Business) of BYD, 2013-2015
Gross Margin (by Business) of BYD, 2010-2015
Electric Bus Sales Volume of BYD, 2012-2017E
New Energy Buses of BYD
Cost Breakdown of BYD K9 Battery Electric Bus
BYD Power & Energy Storage Battery Business Scale, 2011-2017E
Technical Parameters of Ferric Manganese Phosphate Lithium Battery
Capacity, Weight and Cost of BYD Power Battery Pack
Electric Vehicle Sales Volume of BYD, 2011-2017E
Equity Structure of Xiamen King Long Motor Group, 2014
Main Financial Indexes of Xiamen King Long Motor Group, 2010-2016Q1
Revenue Breakdown of Xiamen King Long Motor Group by Region, 2009-2015
Electric Bus Sales Volume of Xiamen King Long Motor Group, 2011-2015
New Energy Bus Sales Volume (by Length) of Xiamen King Long Motor Group, 2015
New Energy Bus Sales Volume/Value (by Purpose) of Xiamen King Long Motor Group, 2015
Series-parallel Power Hybrid System of Xiamen Golden Dragon Bus
Output (by Model) of Xiamen King Long Motor Group, 2010-2016, 1-5
Sales Volume (by Model) of Xiamen King Long Motor Group, 2010-2016, 1-5
Electric Bus Investment Plan of Xiamen King Long Motor Group
Electric Bus Sales Volume of Nanjing Golden Dragon Bus, 2013-2017E
Equity Structure of Zhongtong Bus & Holding, 2014
Operating Performance of Zhongtong Bus & Holding, 2010-2016Q1
Revenue and Gross Margin (by Region) of Zhongtong Bus & Holding, 2010-2015
Electric Bus Output of Zhongtong Bus & Holding, 2011-2015
Electric Bus Output Proportion of Zhogntong Bus & Holding, 2011-2015
Core Suppliers for Electric Bus of Zhongtong Bus & Holding
Sales Volume of Zhongtong Bus & Holding, 2010-2016, 1-6
Electric Bus Projects under Construction of Zhongtong Bus & Holding
Equity Structure of BeiqiFoton Motor
Key Financial Indexes of BeiqiFoton Motor, 2010-2016Q1
Revenue Breakdown (by Product) of BeiqiFoton Motor, 2009-2015
Revenue Breakdown (by Region) of BeiqiFoton Motor, 2010-2015
Electric Bus Output of BeiqiFoton Motor, 2013-2017E
New Energy Bus Sales Volume of Foton AUV, 2013-2016
New Energy Bus Orders of Foton AUV, 2016
Core Suppliers for Electric Bus of BeiqiFoton Motor
Light Bus Revenue and Sales Volume of BeiqiFoton Motor, 2011-2016
Large and Medium Bus Revenue and Sales Volume of BeiqiFoton Motor, 2011-2016
Bus (Including Electric Bus) Capacity Layout of BeiqiFoton Motor
Equity Structure of Shanghai Sunwin Bus Corporation, 2014
Electric Bus Sales Volume of Shanghai Sunwin Bus Corporation, 2013-2017E
Output (by Model) of Shanghai Sunwin Bus Corporation, 2010-2016, 1-6
Sales Volume (by Model) of Shanghai Sunwin Bus Corporation, 2009-2015H1
Bus (Including Electric Bus) Capacity Layout of Shanghai Sunwin Bus Corporation, 2014
Investment Plan of Shanghai Sunwin Bus Corporation
Operating Performance of Hunan CRRC Times Electric Vehicle, 2011-2014
Electric Bus Sales Volume of Hunan CRRC Times Electric Vehicle, 2012-2017E
Core Suppliers for Electric Bus of Hunan CRRC Times Electric Vehicle
Electric Bus Capacity Layout of Hunan CRRC Times Electric Vehicle, 2014
Equity Structure of Anhui Ankai Automobile, 2014
Key Financial Indexes of Anhui Ankai Automobile, 2010-2016Q1
Revenue Breakdown (by Product) of Anhui Ankai Automobile, 2009-2015
Revenue Breakdown (by Region) of Anhui Ankai Automobile, 2010-2015
Electric Bus Sales Volume of Anhui Ankai Automobile, 2012-2017E
Core Suppliers for Electric Bus of Anhui Ankai Automobile
Output (by Model) of Anhui Ankai Automobile, 2010-2016.1-5
Sales Volume (by Model) of Anhui Ankai Automobile, 2010-2016.1-5
Capacity Layout (Including Electric Bus) of Anhui Ankai Automobile
Core Suppliers for Electric Bus of Young Man Bus
Output (by Model) of Young Man Bus, 2010-2016.1-6
Sales Volume (by Model) of Young Man Bus, 2010-2016.1-6
Capacity Layout of Young Man Bus, 2014
Equity Structure of Hengtong Electric Bus
Operating Performance of Chongqing Hengtong Bus, 2012-2015
Electric Bus Sales Volume of Chongqing Hengtong Bus, 2012-2015
Operating Performance of Electric Bus Business of Chongqing Hengtong Bus, 2012-2015
Output (by Model) of Chongqing Hengtong Bus, 2011-2015
Sales Volume (by Model) of Chongqing Hengtong Bus, 2011-2015
Operating Performance of Shenzhen Wuzhoulong Motors, 2012-2015
Global and China Leading Tier1 Suppliers’ Intelligent Cockpit Business Research Report, 2022 (II)
Tier1 Intelligent Cockpit Research: The mass production of innovative cockpits gathers pace, and penetration of new technologies is on a rapid riseGlobal OEMs and Tier 1 suppliers are racing for the i...
Global and China Leading Tier1 Suppliers’ Intelligent Cockpit Business Research Report, 2022 (I)
Tier1 Intelligent Cockpit Research: The mass production of innovative cockpits gathers pace, and penetration of new technologies is on a rapid riseGlobal OEMs and Tier 1 suppliers are racing for the i...
China Commercial Vehicle Intelligent Cockpit Industry Report 2021
Research on Intelligent Cockpits of Commercial Vehicles: Heading for Large Screens, Voice Interaction, Entertainment and Life
Following AD/ADAS functions, the intelligent configuration of the cockpit...
Automotive Ultra Wide Band (UWB) Industry Report, 2022
UWB got initially utilized in the military field, and began to be commercially applied after the release of criteria for UWB commercialization in 2002. In 2019, Car Connectivity Consortium (CCC) liste...
China Automotive Distribution and Aftermarket Industry Report, 2022-2027
Since the introduction of 4S store model into China at the end of 20th century, China's authorized dealer system has gradually developed from a single-store-based mode to a group-based mode, and from ...
Global and China Skateboard Chassis Industry Report, 2021-2022
Research into skateboard chassis: where to sell, how to sell and to whom it is sold
Rivian, a new carmaker based on skateboard chassis, is quite popular in the market and becomes the focus of the aut...
Emerging Automakers Strategy Research Report, 2022--NIO
Research on emerging carmaking strategies: no new cars in 2021, 3 new cars in 2022, can NIO make its renaissance?
The delivery of ET7 is imminent, and the sluggish sales situation is expected to fade...
Automotive and 5G Industry Integration Development Report, 2022
Research on integration of vehicle and 5G: OEMs rush into mass production of 5G models whose sales may reach 3.68 million units in 2025
By the end of 2021, China had built and opened in excess of 1.3...
China Automotive Finance Industry Report, 2022-2030
Auto finance is lucrative with the highest profit margin in the international automobile industry chain, contributing to roughly 23% of the global automobile industry profits. Yet, auto finance only h...
Global and China Power Battery Management System (BMS) Industry Report, 2022-2026
1. Robust demand from new energy vehicle spurs BMS market to boom
New energy vehicle sales have been growing rapidly worldwide over the recent years, reaching 6.5 million units with a year-on-year up...
ADAS/AD Chip Industry Research Report, 2022
Autonomous driving chip research: In addition to computing power, core IP, software stacks, AI training platforms, etc. are becoming more and more importantL2.5 and L2.9 have achieved mass production ...
Automotive Sensor Chip Industry Research Report, 2022
Sensor Chip Research: Automotive Sensors Have Entered a Technology Iteration Cycle, and Opportunities for Localization of Chips Are Coming Automotive sensor chips can obtain external environment ...
Automotive Cloud Service Platform Industry Report, 2021-2022
Research on Automotive Cloud Services: Based on 5ABCD, cloud services run through the R&D, production, sale, management and services of automakersWith the development of intelligent connectivity, ...
Global and China Cobalt Industry Report, 2021-2026
As a very rare metal and an important strategic resource for a country, cobalt gets typically utilized in battery materials, super heat-resistant alloys, tool steels, cemented carbides, and magnetic m...
Automotive Event Data Recorder (EDR) Industry Report, 2022
An event data recorder (EDR), sometimes referred to informally as an automotive black box, is a device or a system installed in vehicle to monitor, collect and record technical vehicle data and occupa...
Commercial Vehicle ADAS Industry Report, 2021
ResearchInChina has published the "Commercial Vehicle ADAS Industry Report, 2021", focusing on policy climate, ADAS installations, suppliers, etc., and with a deep dive into the prospects of Chinese c...
Automotive High-precision Positioning Research Report, 2022
High-precision Positioning Research: from L2+ to L3, high-precision integrated navigation and positioning will become the standard
With the development and progress of the autonomous driving industry...
China Around View System (AVS) Suppliers and Technology Trends Report, 2021 –Joint Venture Automakers
Research into JV automakers’ around view system: large-scale implementation of AVP is round the corner, and AVS vendors are energetically pushing ahead with parking fusion solution.
During January to...