Global and China Tire Industry Report, 2016-2020
-
Jan.2017
- Hard Copy
- USD
$2,700
-
- Pages:232
- Single User License
(PDF Unprintable)
- USD
$2,500
-
- Code:
CYH057
- Enterprise-wide License
(PDF Printable & Editable)
- USD
$3,900
-
- Hard Copy + Single User License
- USD
$2,900
-
In 2016, the steady growth in the global automobile market and the rapid growth of Chinese automobile market stimulated the tire market to recover slightly. The global tire shipment increased by 2% year on year to 1.963 billion, while China's automotive tire output edged up 1.2% to 572 million. In 2017-2020, Chinese automotive tire market is expected to grow by approximately 4%.
The operating rate of the Chinese market rebounded significantly in 2016, especially showed an uptrend in the off-season after October; in early December, the operating rates of all-steel tire and semi-steel tire plants stayed at 72.7% and 73.4% respectively, 10.5 and 7.5 percentage points higher than the same period last year each.
Under the impact of rising natural rubber (which is a raw material) price, China’s tire price has stopped falling to stabilize since the second half of 2016. Most tire companies announced to raise prices, for instance, Michelin, Bridgestone, Continental, Pirelli, Goodyear and other international first-tier brand manufacturers declared price hike at the end of December. Along with the bullish trend of the natural rubber price, tires will see a new round of price increase in 2017.
Due to anti-dumping and countervailing investigations launched by the United States, China's tire export suffered a serious setback in 2015, and the annual export volume of automotive tires dropped 4.12% year on year. The figure restored in 2016, and increased by 7.3% year on year from January to November, but the export to the US market declined. The United States will make the final ruling about anti-dumping and countervailing investigations on China's trucks and buses as well as the austerity policy of the President-elect will put pressure on China's tire export in January 2017, so the export to the US market in 2017 is still not optimistic.
As for enterprises, Bridgestone, Michelin, Goodyear, Continental and Pirelli rank the top five in the world. Amid the fast-growing Chinese automobile market, the world's major tire giants have deployed production bases in China and further increased investment in expansion over the recent two years, for example, Continental started its Phase III project in Hefei in November 2015 so as to level up the capacity in China to 14 million tyres/a, Goodyear conducted the expansion of Dalian Plant in November 2016 with a new capacity of 5 million tyres/a.
In a bid to avoid the influence of anti-dumping and countervailing investigations launched as well as trade friction by the United States on export, China's major local manufacturers have accelerated the overseas layout, such as the world's 10th-ranked and China's first-ranked Hangzhou Zhongce Rubber has set up a tire factory in Thailand, Linglong Tire’s Thai Factory Phase I was put into operation in 2016 and Phase II is under construction, Double Coin opened its first overseas factory in Thailand in July 2016.
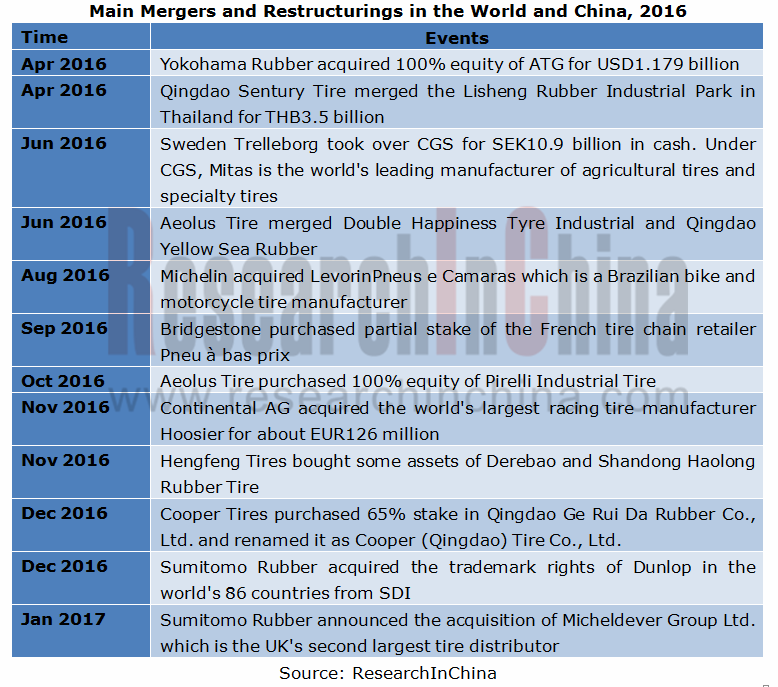
In addition, the mergers and restructurings of global and Chinese tire companies swelled in 2016, like: Yokohama Rubber acquired ATG; Aeolus Tire took over Yellow Sea Rubber and Double Happiness Tyre Industrial;Hengfeng Tires bought the assets of Derebao and Shandong Haolong Rubber Tire. In 2017, the corporate integration trend will be more obvious.
The report highlights the following:
 Development, trend, etc. of global automobile industry and market;
Development, trend, etc. of Chinese automobile industry and market;
Development of global tire market, ranking of top 30 companies, development trend, etc.;
Tire market size, ranking of top 10 enterprises by revenue and output, import and export, radial tire market development and trend, etc. in China and the United States;
Market development, price trend and development trend of major tire raw materials such as natural rubber, synthetic rubber, carbon black and the like;
Operation and development strategies of 27 key tire enterprises.
1 Global Automobile Market and Industry
1.1 Global Automobile Market
1.2 Automobile Market in the United States
1.3 Automobile Market in Japan and Brazil
1.4 Automobile Market in Britain, France and Germany
1.5 Automobile Market in South Korea and Italy
2 Chinese Automobile Market and Industry
2.1 Overview
2.2 Developments
2.3 Analysis
3. Global Tire Market
3.1 Market Size
3.2 Ranking
3.3 American Tire Market
3.3.1 Market Size
3.3.2 Ranking of Tire Dealers
3.3.3 Market Share of Major Tire Vendors
3.3.4 Market Share of Major OTR Vendors
3.3.5 OE Tire Market Analysis
3.3.6 North American Automotive Tire Industry
3.4 Chinese Tire Market
3.5 China Tire Industry
3.6 China's Tire Export
3.7 China All-steel Radial Tire Industry
3.8 China's Tire Price
3.9 Market Share of Major Tire Vendors in China
3.10 Top 10 Tire Vendors in China
3.11 Tire Anti-dumping in China and the United States
4. Raw Material Market
4.1 Natural Rubber
4.1.1 Global Natural Rubber Market
4.1.2 Chinese Natural Rubber Market
4.1.3 Natural Rubber Price
4.1.4 Layout of Chinese Tire Enterprises in Natural Rubber
4.2 Synthetic Rubber
4.3 Carbon Black
5. Leading Tire Vendors Worldwide
5.1 Michelin
5.2 Bridgestone
5.3 Goodyear
5.4 Continental
5.5 Sumitomo Rubber Group
5.6 Pirelli
5.7 Yokohama Rubber
5.8 Hankook
5.9 Cooper
5.10 Kumho Tire
5.11 Toyo Tire & Rubber
5.12 Apollo Tyres
5.13 MRF
5.14 Nokian
5.15 Cheng Shin Tire
5.16 Hangzhou Zhongce Rubber
5.17 Triangle Tire
5.18 Linglong Tire
5.19 Aeolus Tire
5.20 Double Coin
5.21 Jiangsu General Science Technology
5.22 Guizhou Tire
5.23 Qingdao Double Star
5.24 Xingyuan
5.25 Sailun Jinyu
5.26 Giti Tire
5.27 Shengtai
Global Automobile Output, 2010-2016
Global Vehicle Sales by Region, Jan-Nov 2016
Global Monthly Automobile Sales Volume, 2015-2016
Global Automobile Sales Volume, 2010-2016
Geographical Distribution of Global Light Vehicle Output, 2003-2016
Geographical Distribution of Global Light Vehicle Output, 2016-2023E
Automobile Sales Volume in the United States (by Model), 2015-2016
Monthly Automobile Output in the United States, 2015-2016
Monthly Light Vehicle Sales Volume in the United States, 2015-2016
Accumulative Light Vehicle Sales Volume in the United States (by Manufacturer), 2016
Automobile Output and Sales Volume in Brazil, 2016
Automobile Sales Volume in Germany, 2016
Automobile Sales Volume in United Kingdom, 2016
Passenger Car Sales Volume in France (by Brand), 2016
Sales Volume of Automakers in South Korea, 2016
New Car Sales Volume in Italy, 2016
China’s Automobile Sales Volume, 2005-2016
China’s Monthly Automobile Sales Volume, 2016
YoY Growth Rate of China’s Annual Automobile Sales Volume, 2008-2016
China’s Automobile Sales Volume and Market Share (by Series), 2009-2016
China's New Energy Vehicle Sales Volume, 2011-2016
China's New Energy Passenger Car Sales Volume, 2012-2016
China's Monthly Automobile Sales Volume, 2010-2016
China's Passenger Car Sales Volume, 2006-2016
China's Commercial Vehicle Sales Volume, 2006-2016
Global Tire Market Size, 2013-2020E
Automotive Tire Market Size, 2014-2020E
Geographical Distribution of Global Tire Shipment, 2017
Global Top 30 Tire Manufacturers by Revenue, 2010-2015
Operating Margin of Global Major Tire Manufacturers, 2011-2015
Passenger Car OE and Replacement Tire Shipment in the United States, 2004-2016
Light Truck OE and Replacement Tire Shipment in the United States, 2004-2016
Medium/Heavy Truck OE and Replacement Tire Shipment in the United States, 2004-2016
Replacement Tire Sales in the United States, 2015
Truck Tire Replacement Market Breakdown, 2000-2015
Consumer Tire Distribution by Channel and Market Share in the United States, 1995-2015
Distribution of Tire Sales Channels in the United States, 2011
Share of Replacement Consumer Tire Brands in the United States, 2014-2015
Share of Replacement Consumer Tire Brands in the United States, 2013
Share of Replacement Medium/Heavy Truck Tire Brands in the United States, 2015
Share of Replacement Medium/Heavy Truck Tire Brands in the United States, 2014
Share of Replacement Medium/Heavy Truck Tire Brands in the United States, 2013
Market Share of Retreaded Truck Tires in the United States, 2015
Most Popular Domestic OE Passenger and LT Tire Sizes
Tire Average Price in the United States, 2014-2015
OE Farm Tire Market Share in the United States, 2014-2015
Replacement Farm Tire Market Share in the United States, 2013
Market Share of OE Tire Suppliers for Chrysler/Fiat, 2014-2015
Market Share of OE Tire Suppliers for BMW, 2014-2015
Market Share of OE Tire Suppliers for Nissan, 2014-2015
Market Share of OE Tire Suppliers for Ford, 2014-2015
Market Share of OE Tire Suppliers for GM, 2014-2015
Market Share of OE Tire Suppliers for TOYOTA , 2014-2015
Market Share of OE Tire Suppliers for HONDA, 2014-2015
Market Share of OE Tire Suppliers for Mercedes-Benz, 2014-2015
Market Share of OE Tire Suppliers for VW, 2014-2015
Ranking of Automobile Tire Manufacturers in North America by Revenue, 2013-2015
Output of Tire Manufacturers in North America, 2016
China’s Automobile Tire Market Size, 2010-2020E
China’s Automobile Tire OE and Replacement Market Size, 2009-2017
Tire Matching and Replacement Amount by Type
China’s Automobile Tire Output, 2007-2016
Monthly Operating Rate of Chinese All-steel Tires, 2015-2016
Monthly Operating Rate of Chinese Semi-steel Tires, 2015-2016
Geographical Distribution of China’s Tire Output, 2014
Distribution of Chinese Tire Manufacturers
Capacity of First-tier Tire Manufacturers in China
Capacity of Second-tier Tire Manufacturers in China
New Capacity of Chinese Tire Outer Covers, 2006-2016
Output of China’s Top 15 Tire Enterprises, 2013-2016
China’s Automotive Tire Export Volume, 2008-2016
Share of China’s PCR Tire Major Export Destinations by Export Volume, 2015-2016
China’s TBR Export Volume and Share of Major Export Destinations, Nov 2016
Monthly Tire Export Volume of China’s Major Provinces, 2016
Top 10 Enterprises in Shandong Province by Tire Export, 2015
U.S. Consumer Tire Imports from China, 2003-2015
U.S. Truck Tire Imports from China, 2011-2015
Export Value of Chinese Inflatable Rubber Tires to the United States, 2012-2016
Export Volume of Chinese Rubber Tires to the United States, 2013-2016
China’s Tire Meridianization Rate, 2004-2016
China’s All-steel Radial Tire Output, 2005-2016
Top 10 All-steel Tire Enterprises in China by Output 2008-2015
Tire Price Hike of Major Tire Enterprises in China, 2016
Capacity Distribution of Semi-steel Tire Enterprises in China, 2016
Capacity Distribution of All-steel Tire Enterprises in China, 2016
Market Share of Major Sedan Tire OE Manufacturers in China, 2015
Market Share of Major Cross-type Passenger Car Tire Manufacturers in China, 2015
Market Share of Major Truck Tire Manufacturers in China, 2015
Top 10 Tire Manufacturers in China by Tire Revenue, 2013-2016
Sino-US Tire Anti-dumping process and Result, by the end of 2016
Statistics of Chinese Bankrupt Tire Enterprises Since 2015
Overseas Layout of Chinese Tire Enterprises
Main Mergers and Acquisitions of Chinese Major Tire Enterprises
Tire Cost Structure
Global Natural Rubber Output and YoY Growth, 2008-2016
Global Natural Rubber Output by Country, 2013-2015
Global Natural Rubber Consumption and YoY Growth, 2008-2016
China’s Natural Rubber Output and YoY Growth, 2008-2016
China’s Natural Rubber Self-sufficiency Rate, 2005-2016
China’s Natural Rubber Consumption and YoY Growth, 2008-2016
Import Volume and YoY Growth of Natural Rubber in China, 2004-2016
Natural Rubber Output and Consumption in China, 2015-2020E
International Natural Rubber Trend, 2014-2016
China’s Natural Rubber Price Trend, 2016
Natural Rubber Layout of Chinese Major Tire Enterprises
Synthetic Rubber Output and Consumption in China, 2003-2020E
China’s Butadiene Rubber Price Trend, 2012-2016
China’s Styrene-butadiene Rubber Price Trend, 2012-2016
China’s Carbon Black Capacity, 2007-2016
China’s Carbon Black Price Trend, 2016
China’s Carbon Black Import and Export Volume, 2004-2016
Michelin’s Revenue and Operating Margin, 2004-2016
Michelin’s Operating Income and Margin, 2007-2016
Michelin’s Passenger Car Tire Operating Income and Margin, 2007-H1 2016
Michelin’s Strong Truck Tire Operating Income and Margin, 2007-2016
Michelin’s Operating Income Structure by Division, 2010-2016
Michelin’s Revenue by Division, 2009-2016
Michelin’s Operating Margin by Division, 2009-2016
Michelin’s Net Sales by Drivers, 2015
Michelin’s Revenue by Region, 2014-H1 2016
Michelin’s Net Sales by Currency, 2015-H1 2016
Michelin’s Quarterly Volumes and Price-mix, 2015-2016
Michelin’s Development Goals, 2017-2020E
Michelin’s Capital Expenditure and Depreciation, 2015-2020E
Michelin’s Financial Goals, 2020E
Michelin’s Operating Margin Goals by Product, 2016-2020E
Michelin’s Brand Passenger Car Volume Growth, 2010-2015
Michelin’s Tire Shipment by Size, 2013-2015
Layout of Michelin’s Passenger Car and Light Truck Tire Factories, 2005-2016
Michelin’s New Light Vehicle Tire Factories in Mexico
Michelin’s PC/LT Tire Capacity and Capacity Utilization, 2012-2020E
Revenue of Michelin China by Region
Distribution of Michelin in China
Distribution of Michelin’s Dealers in China
Accumulative Investment of Shenyang Michelin, 2009-2019E
Ramp-up of Shenyang Michelin, 2010-2019E
Bridgestone’s Revenue and Operating Margin, 2007-2016
Bridgestone’s Revenue by Region, 2004-2016
Bridge Diagram of Bridgestone’s Operating Income, 2016
Bridgestone’s Tire Revenue and Capital Expenditure, 2012-2015
Distribution of Bridgestone’s Global Factories, Dec 2016
Bridgestone’s Tire Output (by Region), 2011-2015
Bridgestone’s Brand Value, 2010-2016
Distribution of Bridgestone in China
Goodyear’s Revenue and Operating Margin, 2004-2016
Goodyear’s Sales Volume, 2007-2016
Goodyear’s Sales Volume by Application, 2016-2015
Goodyear’s Revenue by Region, 2008-2016
Goodyear’s Operating Margin by Region, 2008-2015
Sales Ratio of Goodyear’s Replacement Tires by Region, 2006-2013
Goodyear’s Tire Sales Volume by Region, 2006-2016
Goodyear’s Tire Capacity Expansion Project
Goodyear’s Branded Retail Expansion by Store Type in China, 2010-2015
Goodyear’s Branded Retail Expansion by City Tier in China, 2010-2015
Goodyear’s Tire Layout in China’s Third- and Fourth-tier Cities, 2015-2020E
Continental’s Revenue and Net Income, 2000-2016
Distribution of Continental’s Subsidiaries, 2015
Continental’s Revenue by Region and Business Distribution, 2010-2015
Key Figures of Continental’s Tire Business, 2013-2015
Continental’s Tire Brands
Continental’s Tire Revenue by Region, 2010&2015
Continental’s PLT Tire Additional Capacity by Region, 2018E
Continental’s Tire Business Development Goals, 2025E
Continental’s PLT Tire Capacity by Region (excluding Europe), 2013-2015
Continental’s PLT Tire Capacity in Europe by Region, 2013-2015
Continental's CV Tire Capacity by Region, 2013-2015
Continental's PLT Tire Sales Volume, 2010-2014
Continental's CV Tire Sales Volume, 2010-2015
Distribution of Continental's Tire factories, 2015
Labor Costs of Continental's Tire factories, 2015
Continental's Tire Business Goals, 2025E
Revenue and Operating Margin of Sumitomo Rubber, 2004-2016
Operating Income of Sumitomo Rubber, 2011-2015
Revenue of Sumitomo Rubber by Region, 2007-2015
Revenue of Sumitomo Rubber by Product, 2007-2016
Operating Income of Sumitomo Rubber by Product, 2007-2016
Tire Sales Volume of Sumitomo Rubber, 2011-2015
Tire OE/RT Sales Volume of Sumitomo Rubber (by Region), 2014-2016
Tire Sales Volume of Sumitomo Rubber outside Japan by Region, 2009-2016
Tire Capacity of Sumitomo Rubber by Region, 2011-2016
Tire Output of Sumitomo Rubber, 2009-2016
Output and Capacity Utilization of Sumitomo Rubber, 2006-2016
Pirelli's Revenue and Operating Margin, 2006-2016
Pirelli's Tire Sales by Channel, 2006-2016
Pirelli's Tire Sales by Business, 2012-2015
Pirelli's Tire Sales by Segment, 2013-2015
Pirelli's Tire Sales by Region, 2012-2015
Pirelli's Tire Raw Material Costs, Jan-Sep 2016
Pirelli's Tire Raw Material Costs, 2015
Pirelli's Tire Raw Material Costs, 2013
Pirelli's Tire Raw Material Costs, 2014
Geographical Distribution of Pirelli's Employees, 2016
Pirelli's Global Distribution
Revenue and Operating Margin of Yokohama Rubber, 2006-2016
Tire Revenue of Yokohama Rubber by Region, 2006-2015
Tire Revenue Distribution of Yokohama Rubber, 2006-2015
Revenue of Yokohama Rubber by Business, 2016
Capacity of Global Factories of Yokohama Rubber, 2011-2014
Tire Capacity of Yokohama Rubber, 2014-2020E
Global Layout of Yokohama Rubber
Expansion Plan of Yokohama Rubber, 2014-2020
Hankook’s Tire Revenue and Operating Margin, 2003-2016
Hankook’s Revenue by Region, Q4 2013-Q4 2014
Hankook’s Tire Revenue by Region, 2015
Hankook’s Expanding TBR OE and Fleet Business in Europe, 2016
Hankook’s Tire Output by Region, 2005-2015
Quarterly Revenue and Gross Margin of Hankook China, 2015-2016
Cooper’ Facts
Cooper’s Revenue and Operating Margin, 2004-2016
Cooper’s Revenue by Region, 2006-2016
Cooper’s Revenue by Product, 2012
Cooper’s Factory Distribution, 2015
Cooper’s Capex, M&A and Dividend, 2013-2016
Facts of Qingdao GRT
Revenue and Operating Margin of Kumho Tire, 2005-2016
Capacity Distribution of Kumho Tire
Revenue of Kumho Tire by Region, 2013-2015
Shipment and ASP of Kumho Tire, 2009-2013
Global Sales Trend of High-inch Tires of Kumho Tire, 2010-Q3 2016
Output of Kumho Tire by Region, 2012-2016
Trend of Quarterly Raw Material Costs (Based on Input Costs) of Kumho Tire, 2014-2016
Revenue and Operating Margin of Kumho Tire China, Q4 2013-Q1 2016
Quarterly Output of Kumho Tire in China, 2015-2016
Revenue and Operating Margin of Toyo Tire & Rubber, 2007-2016
Operating Income of Toyo Tire & Rubber, 2015-2016
Revenue of Toyo Tire & Rubber by Region, 2007-2016
Output of Toyo Tire & Rubber by Region, 2011-2016
Sales Volume of Toyo Tire & Rubber by Region, 2011-2016
Apollo Tyres at a Glance, 2016
Regional Distribution of Apollo Tyres, 2016
Development Course of Apollo Tyres
Revenue and Net Profit Margin of Apollo Tyres, FY2007-FY2016
Revenue of Apollo Tyres by Product, FY2015
Major Copartners of Apollo Tyres, 2016
Revenue and Capacity of Apollo Tyres by Region, FY2012
Revenue of Apollo Tyres by Region
Operating Income of Apollo Tyres by Region
MRF’s Revenue and Profit, FY2006-FY2016
Nokian’s Revenue and Operating Margin, 2004-2016
Nokian’s Revenue by Region, 2013-2016
Nokian’s Revenue by Business, 2012-2016
Nokian’s EBIT Margin by Division, 2013-2016
Nokian’s Raw Material Cost Development, 2010-2016
Nokian’S Raw Material Consumption, 2016
Nokian’s Global Distribution, 2016
Revenue and Operating Margin of Cheng Shin Tire, 2003-2016
Rubber Capacity of Cheng Shin Tire, 2016
Global Distribution of Factories of Cheng Shin Tire, 2016
Introduction to Factories of Cheng Shin Tire
Revenue of Major Subsidiaries of Cheng Shin Tire, 2015-H1 2016
Revenue of Cheng Shin Tire by Subsidiary, H1 2016
Revenue of Cheng Shin Tire by Region, 2011-2015
Revenue of Cheng Shin Tire by Product, 2012-2016
Revenue of Cheng Shin Tire by Product and Shipment, H1 2016
Revenue of Cheng Shin Tire by Region, H1 2016
Raw Material Cost Structure of Cheng Shin Tire, H1 2016
CST’s Revenue by OE & RE Customer, H1 2016
Vehicle Models Supported by Cheng Shin Tire in China
Hangzhou Zhongce Rubber, 2016
Revenue and Operating Margin of Hangzhou Zhongce Rubber, 2007-2016
Revenue and Output of Hangzhou Zhongce Rubber, 2007-2016
Tire Brands of Hangzhou Zhongce Rubber
Organizational Structure of Hangzhou Zhongce Rubber
Revenue and Operating Margin of Triangle Tire, 2013-2016
Revenue and Output of Triangle Tire, 2013-2016
Capacity, Output and Sales Volume of Triangle Tire (by Application), 2013-2016
Capacity, Output and Sales Volume of Triangle Tire (by Product), 2013-2016
Revenue and Structure of Triangle Tire (by Application), 2013-2016
Revenue and Structure of Triangle Tire (by Product), 2013-2016
Replacement & OEM Revenue and Percentage of Triangle Tire, 2013-2016
Overseas Revenue and Structure of Triangle Tire (by Region), 2013-2016
All-steel Tire Revenue and Gross Margin of Triangle Tire, 2013-2016
Semi-steel Tire Revenue and Gross Margin of Triangle Tire, 2013-2016
Bias Tire Revenue and Gross Margin of Triangle Tire, 2013-2016
Distribution of Triangle Tire’s Subsidiaries
Revenue and Operating Margin of Linglong Tire, 2007-2016
Revenue and Output of Linglong Tire, 2007-2016
Revenue of Linglong Tire (by Region), 2013-2016
Sales Volume and Revenue of Linglong Tire (by Product), 2013-2015
Gross Margin and Revenue Structure of Linglong Tire (by Product), 2013-2015
Capacity, Output and Sales Volume of Linglong Tire (by Product), 2013-2016
Distribution of Linglong Tire’s Subsidiaries
Linglong Tire’s Major Projects under Construction, 2016
Revenue and Operating Margin of Aeolus Tire, 2006-2016
Output and Sales Volume of Aeolus Tire, 2014-2016
Organizational Structure of Aeolus Tire
Revenue and Operating Margin of Double Coin, 2005-2014
Revenue and Operating Margin of Shanghai Huayi Group, 2013-2016
Output of Double Coin (by Product), 2010-2016
Tire Revenue and Operating Costs of Shanghai Huayi Group, 2015-2016
Revenue and Structure of Jiangsu General Science Technology (by Product/Sales Model), 2013-2016
Tire Capacity and Output of Jiangsu General Science Technology by Type, 2013-2016
Tire Output and Sales Volume of Jiangsu General Science Technology by Type, 2013-2016
Revenue and Structure of Jiangsu General Science Technology (by Product), 2013-2016
All-steel Tire Revenue and Structure of Jiangsu General Science Technology (by Region), 2013-2016
Bias Tire Revenue and Structure of Jiangsu General Science Technology (by Region), 2013-2016
Gross Margin of Jiangsu General Science Technology (by Product), 2013-2016
Tire Cost Structure of Jiangsu General Science Technology, 2016
Equity Structure of Jiangsu General Science Technology
Revenue and Operating Margin of Guizhou Tire, 2006-2016
Tire Output of Guizhou Tire by Type, 2013-2016
Tire Output and Sales Volume of Guizhou Tire, 2013-2016
Sales Volume and Revenue of Guizhou Tire (by Product), 2015
Export Volume and Value of Guizhou Tire, 2013-2015
Revenue and Operating Margin of Qingdao Double Star, 2004-2016
Tire Capacity, Output and Sales Volume of Qingdao Double Star (by Product), 2013-2015
Export Volume and Value of Qingdao Double Star, 2013-2015
Xingyuan’sRevenue and Operating Margin, 2007-2013
Revenue and Operating Margin of Sailun Jinyu, 2009-2016
Revenue of Sailun Jinyu by Product, 2013-2016
Gross Profit and Gross Margin of Sailun Jinyu by Product, 2013-2016
Tire Revenue of Sailun Jinyu (by Region), 2013-2015
Tire Capacity, Output and Sales Volume of Sailun Jinyu, 2013-2015
Tire Cost Structure of Sailun Jinyu, 2013-2015
SailunJinyu’s Major Projects under Construction, 2016
Revenue by Geographical Location, 2012
Revenue and Operating Income of Giti Tire, 2006-2015
Global and China Leading Tier1 Suppliers’ Intelligent Cockpit Business Research Report, 2022 (II)
Tier1 Intelligent Cockpit Research: The mass production of innovative cockpits gathers pace, and penetration of new technologies is on a rapid riseGlobal OEMs and Tier 1 suppliers are racing for the i...
Global and China Leading Tier1 Suppliers’ Intelligent Cockpit Business Research Report, 2022 (I)
Tier1 Intelligent Cockpit Research: The mass production of innovative cockpits gathers pace, and penetration of new technologies is on a rapid riseGlobal OEMs and Tier 1 suppliers are racing for the i...
China Commercial Vehicle Intelligent Cockpit Industry Report 2021
Research on Intelligent Cockpits of Commercial Vehicles: Heading for Large Screens, Voice Interaction, Entertainment and Life
Following AD/ADAS functions, the intelligent configuration of the cockpit...
Automotive Ultra Wide Band (UWB) Industry Report, 2022
UWB got initially utilized in the military field, and began to be commercially applied after the release of criteria for UWB commercialization in 2002. In 2019, Car Connectivity Consortium (CCC) liste...
China Automotive Distribution and Aftermarket Industry Report, 2022-2027
Since the introduction of 4S store model into China at the end of 20th century, China's authorized dealer system has gradually developed from a single-store-based mode to a group-based mode, and from ...
Global and China Skateboard Chassis Industry Report, 2021-2022
Research into skateboard chassis: where to sell, how to sell and to whom it is sold
Rivian, a new carmaker based on skateboard chassis, is quite popular in the market and becomes the focus of the aut...
Emerging Automakers Strategy Research Report, 2022--NIO
Research on emerging carmaking strategies: no new cars in 2021, 3 new cars in 2022, can NIO make its renaissance?
The delivery of ET7 is imminent, and the sluggish sales situation is expected to fade...
Automotive and 5G Industry Integration Development Report, 2022
Research on integration of vehicle and 5G: OEMs rush into mass production of 5G models whose sales may reach 3.68 million units in 2025
By the end of 2021, China had built and opened in excess of 1.3...
China Automotive Finance Industry Report, 2022-2030
Auto finance is lucrative with the highest profit margin in the international automobile industry chain, contributing to roughly 23% of the global automobile industry profits. Yet, auto finance only h...
Global and China Power Battery Management System (BMS) Industry Report, 2022-2026
1. Robust demand from new energy vehicle spurs BMS market to boom
New energy vehicle sales have been growing rapidly worldwide over the recent years, reaching 6.5 million units with a year-on-year up...
ADAS/AD Chip Industry Research Report, 2022
Autonomous driving chip research: In addition to computing power, core IP, software stacks, AI training platforms, etc. are becoming more and more importantL2.5 and L2.9 have achieved mass production ...
Automotive Sensor Chip Industry Research Report, 2022
Sensor Chip Research: Automotive Sensors Have Entered a Technology Iteration Cycle, and Opportunities for Localization of Chips Are Coming Automotive sensor chips can obtain external environment ...
Automotive Cloud Service Platform Industry Report, 2021-2022
Research on Automotive Cloud Services: Based on 5ABCD, cloud services run through the R&D, production, sale, management and services of automakersWith the development of intelligent connectivity, ...
Global and China Cobalt Industry Report, 2021-2026
As a very rare metal and an important strategic resource for a country, cobalt gets typically utilized in battery materials, super heat-resistant alloys, tool steels, cemented carbides, and magnetic m...
Automotive Event Data Recorder (EDR) Industry Report, 2022
An event data recorder (EDR), sometimes referred to informally as an automotive black box, is a device or a system installed in vehicle to monitor, collect and record technical vehicle data and occupa...
Commercial Vehicle ADAS Industry Report, 2021
ResearchInChina has published the "Commercial Vehicle ADAS Industry Report, 2021", focusing on policy climate, ADAS installations, suppliers, etc., and with a deep dive into the prospects of Chinese c...
Automotive High-precision Positioning Research Report, 2022
High-precision Positioning Research: from L2+ to L3, high-precision integrated navigation and positioning will become the standard
With the development and progress of the autonomous driving industry...
China Around View System (AVS) Suppliers and Technology Trends Report, 2021 –Joint Venture Automakers
Research into JV automakers’ around view system: large-scale implementation of AVP is round the corner, and AVS vendors are energetically pushing ahead with parking fusion solution.
During January to...