Global and China Tire Industry Report, 2019-2025
-
May 2019
- Hard Copy
- USD
$3,400
-
- Pages:243
- Single User License
(PDF Unprintable)
- USD
$3,200
-
- Code:
ZHP090
- Enterprise-wide License
(PDF Printable & Editable)
- USD
$4,800
-
- Hard Copy + Single User License
- USD
$3,600
-
In 2018, global automobile market encountered its first downturn for the five years. Global automobile production edged down 1.7% on an annualized basis due to weak demand and political rivalries among great powers, of which passenger car declined by 4.1% and commercial vehicle rose 5.5%. The Chinese automobile market showed negative growth for the first time after 28 consecutive years of expansion, as a result of factors such as maturity of the market leaving smaller room to grow, the slowing Chinese economy and the expiration of some automobile promotion incentives. In the context of the depressed Chinese automobile market, its tire industry characterized the following in development in 2018:
1. Market: In 2018, global tire output reached more than 2 billion units, worth RMB1.1 trillion and with a CAGR of about 2.4% between 2013 and 2018; Asia, Europe and North America collectively commanded 70% or so of the global market. As a key manufacturer which supplies nearly one-third of global tires, China made 648 million tires in 2018, at a pace of -0.8%, the first negative growth over a decade. The slight downtrend in output will expectedly continue to 2019 as the country’s tire industry transforms for upgrading.
2. Segments: Passenger car tire market growth will depend largely on replacement demand from passenger car market which consumes over 80% tires and is about to be saturated. Commercial vehicle tire market will slow down due to the saturation of both OEM and replacement markets.
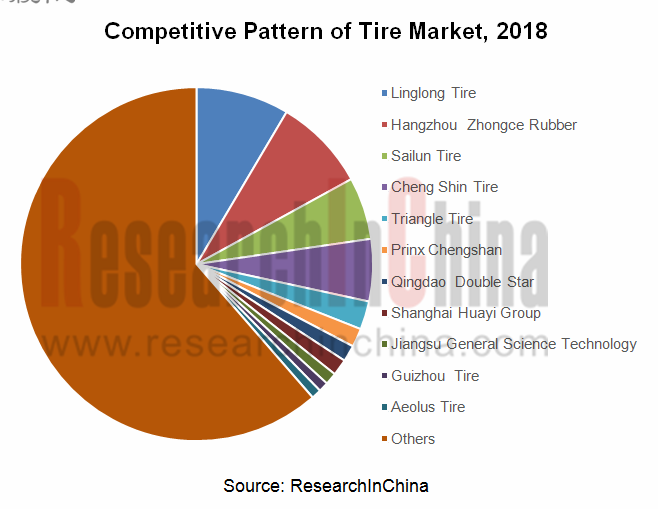
3. Pattern: Global tire industry pattern remains stable now that Bridgestone, Michelin, Goodyear and Jiangsu General Science Technology Co., Ltd. rule the roost; Chinese tire industry gets increasingly concentrated, which means already strong players tend to be stronger, for example, industry leaders like Triangle Tire, Linglong Tire and Hangzhou Zhongce Rubber and other listed companies, make up 80% of the total profits. In contrast, small and medium players have to struggle to survive and some are even in the red. In 2018, tire industry in China saw CR5 of over 30%, of which Linglong Tire and Hangzhou Zhongce Rubber played a leading role each with a market share of 8.5%.
4. Export: In recent years, China has faced a grim dilemma in tire export in the wake of China-US trade war and “anti-dumping and anti-subsidy” duties imposed by European Commission and the U.S. Department of Commerce on Chinese truck tires. China’s tire exports were 287 million units in 2018, presenting a CAGR of 3.8% during 2008-2018, and will get better (the CAGR in China’s tire exports to the United States stood at -30.1% from 2015 to 2018) as the United States removed its antidumping and countervailing duties on Chinese tires in May 2019.
5. Price: the rising prices of raw materials and more investment in environmental protection have pushed up production cost of tire manufacturers that had to raise their prices in recent two years. In early 2019, more than a dozen announced a 2%-5% increase.
6. Trend: China’s tire industry is gearing towards high-end, brand reputation and green manufacturing in pursuit of development, through which Chinese tires have enjoyed a better brand image and a higher penetration that has risen from 20% ten years ago to 40% in replacement market and from 7% to 24% in OEM market.
Global and China Tire Industry Report, 2019-2025 highlights the following:
 Global and China automobile markets (output, sales, etc.);
Global tire industry (the United States, Europe, etc.) (market size, enterprise pattern, etc.);
China tire industry (market size, output, export, competitive pattern, price, etc.);
Raw materials (natural rubber, synthetic rubber, carbon black, etc.) (market size, price, etc.);
28 global tire manufacturers (operation, output, sales channel, etc.).
1 Global Automobile Market and Industry
1.1 Global Automobile Market
1.1.1 Output
1.1.2 Sales Volume
1.2 Automobile Market in the United States
1.3 Automobile Market in Japan and Brazil
1.4 Automobile Market in Germany, Britain and France
1.5 Automobile Market in South Korea and Italy
2 Chinese Automobile Market and Industry
2.1 Overview
2.2 Developments
2.3 Analysis
3. Global Tire Market
3.1 Market Size
3.2 Ranking
3.3 American Tire Market
3.3.1 Market Size
3.3.2 Ranking of Tire Dealers
3.3.3 Market Share of Major Tire Vendors
3.3.4 Market Share of Major Vendors in Farm Tire Market
3.3.5 OE Tire Market Analysis
3.3.6 North American Automotive Tire Industry
3.4 European Tire Market
3.5 Chinese Tire Market
3.5.1 China Tire Industry
3.5.2 China's Tire Export
3.5.3 China All-steel Radial Tire Industry
3.5.4 China's Tire Price
3.5.5 Market Share of Major Tire Vendors in China
3.5.6 Top 10 Tire Vendors in China
3.6 Tire Anti-dumping in China and the United States
4. Raw Material Market
4.1 Natural Rubber
4.1.1 Global Natural Rubber Market
4.1.2 Chinese Natural Rubber Market
4.1.3 Natural Rubber Price
4.1.4 Layout of Chinese Tire Enterprises in Natural Rubber
4.2 Synthetic Rubber
4.3 Carbon Black
5. Leading Tire Vendors Worldwide
5.1 Michelin
5.2 Bridgestone
5.3 Goodyear
5.4 Continental
5.5 Sumitomo Rubber Group
5.6 Pirelli
5.7 Yokohama Rubber
5.8 Hankook
5.9 Cooper
5.10 Kumho Tire
5.11 Toyo Tire &Rubber
5.12 Apollo Tyres
5.13 MRF
5.14 NOKIAN
5.15 Cheng Shin Tire
5.16 Hangzhou Zhongce Rubber
5.17 Triangle Tire
5.18 Linglong Tire
5.19 Aeolus Tire
5.20 Shanghai Huayi Group Corporation Limited (Originally Double Coin)
5.21 Jiangsu General Science Technology Co., Ltd.
5.22 Guizhou Tire
5.23 Qingdao Double Star
5.24 Xingyuan
5.25 Sailun Jinyu Group Co., Ltd.
5.26 Giti Tire
5.27 Shengtai Group
5.28 Prinx Chengshan (Shandong) Tire Co., Ltd.
Global Automobile Output, 2010-2019
Global Light Vehicles Output by Region, 2003-2018
Global Automobile Sales Volume, 2010-2019
Global Automobile Sales by Region, 2018
Global Monthly Automobile Sales Volume, 2017-2019
Global Automobile Sales Volume, 2010-2018
Automobile Sales Volume in the United States (by Model), 2015-2018
Monthly Automobile Output in the United States, 2017-2019
Monthly Light Vehicle Output in the United States, 2017-2019
Top Ten Automobile Brands (by Sales Volume) in the United States, 2018
Automobile Sales Structure in Japan, 2018
Automobile Sales Structure in Brazil, 2017-2018
Automobile Sales Structure in Germany, 2017-2018
Automobile Sales Structure in UK, 2017-2018
Registration Volume of Passenger Car (by Manufacturer) in France, 2018
Automobile Sales Volume in S.Korea, 2018
Vehicle Registration Volume (by Brand) in Italy, 2018
China’s Automobile Sales Volume, 2005-2018
China’s Monthly Automobile Sales Volume, 2016-2018
YoY Growth Rate of China’s Annual Automobile Sales Volume, 2008-2018
China’s Automobile Sales Volume and Market Share (by Series), 2009-2018
China's New Energy Vehicle Sales Volume, 2011-2018
China's New Energy Passenger Car Sales Volume, 2012-2018
China's Passenger Car Sales Volume, 2006-2018
China's Commercial Vehicle Sales Volume, 2006-2018
Global Tire Market Size, 2013-2025E
Car Tire Market Size, 2014-2025E
Car Tire Market Growth by Geography, 2018
Truck Tire Market Growth by Geography,2018
Geographical Distribution of Global Tire Shipment, 2017-2018
Global Top 15 Tire Manufacturers by Revenue, 2010-2018
Operating Margin of Global Major Tire Manufacturers, 2011-2018
Tier Distribution of Global Tire Manufacturers
Value of Global Top Ten Tire Brands, 2018-2019
Passenger Car OE and Replacement Tire Shipment in the U.S., 2008-2019
Light Truck OE and Replacement Tire Shipment in the U.S., 2008-2019
Medium/Heavy Truck OE and Replacement Tire Shipment in the U.S., 2008-2019
U.S. Replacement Tire Sales, 2015-2018
U.S. Independent Tire Dealers Locations
Consumer Tire Distribution Channel Structure in the U.S, 2016-2018
U.S. Replacement Passenger Tire Brand Shares, 2018
U.S. Replacement Light Truck Tire Brand Shares, 2018
U.S. Replacement Medium/Heavy Truck Tire Brand Shares, 2018
U.S. Market Share of Retreaded Truck Tires by Brand, 2018
U.S. Consumer Tire Retail Market Share, 2016-2018
Most Popular Domestic OE Passenger and LT Tire Sizes, 2015-2018
U.S Tire Average Price, 2018
Online Tire Pricing, 2018
U.S. Farm Tire Sales, 2015-2018
U.S. Replacement Farm Tire Market Shares, 2018
U.S. OE Farm Tire Market Shares, 2018
Market Share of OE Tire Suppliers for Chrysler/Fiat, 2017-2018
Market Share of OE Tire Suppliers for BMW, 2017-2018
Market Share of OE Tire Suppliers for Nissan, 2017-2018
Market Share of OE Tire Suppliers for Ford, 2017-2018
Market Share of OE Tire Suppliers for GM, 2017-2018
Market Share of OE Tire Suppliers for TOYOTA, 2017-2018
Market Share of OE Tire Suppliers for HONDA, 2017-2018
Market Share of OE Tire Suppliers for Mercedes-Benz, 2017-2018
Market Share of OE Tire Suppliers for VW, 2017-2018
Market Share of OE Tire Suppliers for SUBARU, 2017-2018
Market Share of OE Tire Suppliers for TESLA, 2017-2018
Market Share of OE Tire Suppliers for Hyunda/KIA, 2017-2018
U.S./Canadian OE Consumer Tire Market Share, 2018
Output of Tire Manufacturers in North America, 2019
Replacement Consumer Tire Sales in Europe (ETRMA members), 2015-2018
Replacement Truck and Bus Tire Sales in Europe (ETRMA members), 2015-2018
Replacement Agricultural Tire Sales in Europe (ETRMA members), 2015-2018
China’s Automobile Tire Market Size, 2010-2025E
China’s Automobile Tire OE and Replacement Market Size, 2009-2025E
Tire Matching and Replacement Amount by Type
China’s PC Tire OE and Replacement Market Size,2017-2021E
China’s PC Tire (≥18'') OE and Replacement Market Size, 2017-2021E
China’s Automobile Tire Output, 2009-2025E
China Tire Output Structure (by Product Type), 2018
Monthly Operating Rate of Chinese All-steel Tires, 2016-2019
Monthly Operating Rate of Chinese Semi-steel Tires, 2016-2018
Geographical Distribution of China’s Tire Output, 2018
Distribution of Chinese Tire Manufacturers
Capacity of First-tier Tire Manufacturers in China
Capacity of Second-tier Tire Manufacturers in China
New Capacity of Chinese Tire Outer Covers, 2008-2019
Capacity of Major Tire Manufacturers in China, 2019
Output of Major Tire Manufacturers in China, 2013-2018
China’s Automotive Tire Export Volume, 2008-2019
China’s Tire Export Destinations, 2018
China's All-Steel Tire Export and Growth, 2009-2018
China's Semi-Steel Tire Export and Growth, 2009-2018
China's Semi-Steel Tire Export Volume by Destinations, 2018
China's All-Steel Tire Export Volume by Destination, 2018
U.S. Consumer Tire Imports from China, 2008-2018
U.S. Truck Tire Imports from China, 2011-2018
Monthly Export Value of Chinese Inflatable Rubber Tires, 2015-2018
Export Volume of Chinese Rubber Tires to the U.S., 2011-2019
China’s Tire Meridianization Rate, 2008-2025E
China’s All-steel Radial Tire Output, 2008-2025E
Top 10 All-steel Tire Enterprises in China by Output, 2008-2018
Tire Price Hike of Major Tire Enterprises in China, 2019
Foreign Brand Proportion in Chinese Tire Market, 2018
Competitive Patern of China Tire Market, 2018
Capacity Distribution of Semi-steel Tire Enterprises in China, 2018
Capacity Distribution of All-steel Tire Enterprises in China, 2018
Market Share of Major Sedan Tire OE Manufacturers in China, 2018
Market Share of Major Cross-type Passenger Car Tire Manufacturers in China, 2018
Market Share of Major Truck Tire Manufacturers in China, 2018
Revenue from Tire of Major Tire Manufacturers in China, 2013-2018
Sino-US Tire Anti-dumping Process and Result, by mid 2019
Statistics of Chinese Bankrupt Tire Enterprises Since 2018
Overseas Layout of Chinese Tire Enterprises
Tire Cost Structure
Global Natural Rubber Output and YoY Growth, 2008-2019
Global Natural Rubber Output by Region, 2016-2018
Global Natural Rubber Output by Country, 2018
Global Natural Rubber Consumption and YoY Growth, 2008-2019E
Global Natural Rubber Consumption Structure by Country, 2018
China’s Natural Rubber Output and YoY Growth, 2008-2019E
China’s Natural Rubber Self-sufficiency Rate, 2005-2019E
China’s Natural Rubber Consumption and YoY Growth, 2008-2019E
Import Volume and YoY Growth of Natural Rubber in China, 2004-2018
Price Trend of Natural Rubber in China, 2018-2019
Price Trend of Natural Rubber SCR5 in China, 2018
Price Trend of Imported Natural Rubber RSS3 in China, 2018
Footprint of Major Chinese Tire Enterprises in Natural Rubber
Synthetic Rubber Output and Consumption in Global, 2016-2018
Synthetic Rubber Output and Consumption in China, 2003-2019E
China’s SBR (1502#) Price Trend, 2018
China’s SBR (1502#) Price Trend, 2019
China’s BR9000 Price Trend, 2018
China’s BR9000 Price Trend, 2019
China’s Carbon Black Capacity Output, 2014-2019
China’s Carbon Black Price Trend, 2018
China’s Carbon Black Import and Export Volume, 2005-2018
Capacity of Michelin by Plant
Michelin’s Revenue and Operating Margin, 2008-2019
Operation of Michelin’s Passenger Car Tire, 2017-2018
Operation of Michelin’s Strong Truck Tire, 2017-2018
Revenue of Michelin by Division, 2009-2019E
Operating Margin of Michelin by Division, 2009-2019
Net Sales of Michelin by Drivers, 2018
Revenue of Michelin by Region, 2017-2018
Net Sales of Michelin by Currency, 2017-2018
Quarterly Volumes and Price-mix of Michelin, 2017-2018
Development Dynamics of Michelin, 2018-2019
Development Goals of Michelin, 2017-2020E
Financial Goals of Michelin, 2020E
Global Development Goals of Michelin, 2016-2021E
Michelin Brand Passenger Car Volume Growth, 2015-2018
Light Truck Tire Plant of Michelin Mexico
Michelin’s Passenger Car and Light Truck Tire Capaciy and Capacity Utilization, 2012-2020
Distribution of Michelin’s Dealers Worldwide
Distribution of Michelin in China
Market Position of Michelin in China
Distribution of Michelin’s Dealers in China
Accumulative Investment of Shenyang Michelin, 2009-2018
Ramp-up of Shenyang Michelin, 2010-2019
Bridgestone’s Revenue and Operating Margin, 2008-2018
Bridgestone’s Revenue by Region, 2008-2018
Bridgestone’s Tire Revenue, 2012-2018
Tire Sales Growth of Bridgestone, 2018
Distribution of Bridgestone’s Global Factories, 2018
Bridgestone’s Tire Output (by Region), 2011-2018
Bridgestone’s Brand Value, 2016-2019
Distribution of Bridgestone's Dealers in China
Distribution of Bridgestone in China
Goodyear’s Revenue and Operating Margin, 2008-2018
Tire Sales Volume of Goodyear, 2007-2019
Goodyear Consumer ≥17'' Sales Volume
Goodyear’s Sales Volume by Application, 2016-2018
Goodyear’s Revenue by Region, 2008-2018
Goodyear’s Operating Margin by Region, 2008-2018
Goodyear’s Tire Sales Volume by Region, 2016-2018
Goodyear’s Tire Capacity Expansion Project
Goodyear’s Tire Layout in China’s Third- and Fourth-tier Cities, 2015-2020E
Distribution of Goodyear's Dealers in China
Continental’s Revenue and Net Income,2003-2018
Distribution of Continental’s Subsidiaries, 2018
Continental’s Revenue Structure by Region and Division, 2014-2018
Key Figures of Continental’s Tire Business, 2017-2018
Continental’s Tire Business Structure, 2018
Continental’s Tire Brands
Continental’s Tire Revenue by Region, 2013&2018
Continental’s PLT Tire Additional Capacity by Region, 2021E
Continental’s Tire Business Development Goals, 2025E
Continental’s PLT Tire Capacity by Region (excluding Europe), 2018
Continental’s PLT Tire Capacity in Europe by Region, 2018
Continental's CV Tire Capacity by Region, 2018
Continental's PLT Tire Sales Volume,
Continental's CV Tire Sales Volume, 2013-2018
Distribution of Continental's Tire factories, 2018
Labor Costs of Continental's Tire factories, 2018
Continental's Tire Business Goals, 2025E
Distribution of Continental in China
Global Layout of Sumitomo Rubber
Revenue and Operating Margin of Sumitomo Rubber, 2008-2019
Operating Income of Sumitomo Rubber by Region, 2014-2018
Revenue of Sumitomo Rubber by Product, 2017-2018
Operating Income of Sumitomo Rubber by Product, 2014-2018
Tire Output of Sumitomo Rubber,2014-2019
Tire Sales Volume of Sumitomo Rubber (by Region), 2014-2019
Tire OE/RT Sales Volume of Sumitomo Rubber (by Region), 2017-2019
Tire Capacity of Sumitomo Rubber by Region, 2014-2019
Tire Brand of Sumitomo Rubber
Layout of Sumitomo Rubber in China, 2018
Major Products of Pirelli
Pirelli's Revenue and Operating Margin, 2006-2019
Pirelli's Tire Sales by Channel, 2008-2019
Pirelli's Tire Sales by Business,2014-2020E
Pirelli's OE/Replacement Tire Sales, 2014-2020E
Pirelli's Car Tire (OE+ Replacement, ≥18'') Sales, 2016-2018
Pirelli's Car Tire (OE+ Replacement, <17'') Sales 2016-2018
Pirelli's Tire Sales by Region,2017-2018
Pirelli's Tire Business Planning, 2020E
Pirelli's Tire Raw Material Cost Structure, 2019
Global Presence of Pirelli
Revenue and Operating Margin of Yokohama Rubber, FY2008-FY2020
Tire Revenue of Yokohama Rubber by Region, FY2008-FY2018
Revenue of Yokohama Rubber by Business, 2018-2019
Tire Capacity of Global Factories of Yokohama Rubber, 2015-2020
Global Layout of Yokohama Rubber
Expansion Plan of Yokohama Rubber, 2014-2020
Global OE Tires Partners of Hankook Tire
Sales and Operating Margin of Hankook Tire, 2008-2018
Hankook Tire’s Revenue by Region, Q4 2017-Q42018
Tire Output of Hankook Tire, 2016-2017
Capacity Distribution of Hankook Tire, 2018
Quarterly Revenue and Gross Margin of Hankook China, 2017-2018
Facts of Cooper
Cooper’s Revenue and Operating Margin, 2008-2019
Cooper’s Revenue by Region, 2008-2018
Raw Material Breakdown of Cooper, 2018
Cooper’s Factory Distribution, 2018
Qingdao Ge Rui Da Rubber (GRT) Facts
Revenue and Operating Margin of Kumho Tire, 2005-2018
Capacity Distribution of Kumho Tire
Revenue of Kumho Tire by Region, 2017-2018
Global Sales Trend of High-inch Tires of Kumho Tire, 2017-2020E
Quarterly Trend of Raw Material Costs (Based on Input Costs) of Kumho Tire, 2017-2018
Revenue of Kumho Tire in China, 2017Q3-2018Q3
Dealers of Kumho Tire in China
Revenue and Operating Margin of Toyo Tire & Rubber, 2008-2019
Revenue Structure of Toyo Tire & Rubber, 2010-2018
Operating Income of Toyo Tire & Rubber, 2010-2018
Revenue of Toyo Tire & Rubber by Region, 2008-2018
Output of Toyo Tire & Rubber by Region, 2015-2019
Sales Volume of Toyo Tire & Rubber by Region, 2015-2019
Distribution of Sales and Production Base of Toyo Tire & Rubber
2017 Apollo Tyres at a Glance
Manufacturing Bases of Apollo Tyres
Development Course of Apollo Tyres
Revenue and Net Profit Margin of Apollo Tyres, FY2008-FY2019
Revenue of Apollo Tyres by Product, FY2018
Major Copartners of Apollo Tyres
Capacity of Apollo Tyres, FY2014-FY2018
Revenue Structure of Apollo Tyres by Region, FY2018
MRF’s Revenue and Profit, FY2008-FY2018
Presence of MRF’s Plants
Nokian’s Revenue and Operating Margin, 2008-2018
Nokian’s Net Sales by Market Area, 2017-2018
Nokian’s Net Sales by Business, 2017-2018
Nokian's Operating Profits by Segment, 2017-2018
Net Sales and Operating Profit of PC Tyres of Nokian, 2014-2018
Net Sales and Operating Profit of Heavy Tyres of Nokian, 2014-2018
Raw Material Consumption of Nokian, 2018
Global Dealers Distribution of Nokian
Profile of Cheng Shin Tire
Revenue and Operating Margin of Cheng Shin Tire,2008-2019
Capacity of Cheng Shin Tire, 2018
Global Distribution of Factories of Cheng Shin Tire, 2018
Introduction to Factories of Cheng Shin Tire
Revenue of Major Subsidiaries of Cheng Shin Tire, 2017-2018
Revenue of Cheng Shin Tire by Region, 2017-2018
Revenue Strucure of Cheng Shin Tire by Region, 2017-2018
Revenue of Cheng Shin Tire by Product, 2017-2018
Revenue of Cheng Shin Tire by Product Shipment, 2017-2018
Major Customers of Cheng Shin
Raw Material Cost Structure of Cheng Shin Tire, 2017-2018
CST’s Revenue by OE & RE Customer, 2018
Vehicle Models Supported by Cheng Shin Tire in China
Latest Vehicle Models Supported by Cheng Shin Tire, 2019
Profile of Hangzhou Zhongce Rubber, 2018
Revenue and Operating Margin of Hangzhou Zhongce Rubber, 2008-2019
Output of Hangzhou Zhongce Rubber, 2008-2019
Sales Volume Structure of Hangzhou Zhongce Rubber by Product, 2018
Tire Brands of Hangzhou Zhongce Rubber
Major Tire Dealers of Hangzhou Zhongce Rubber
Organizational Structure of Hangzhou Zhongce Rubber
Revenue and Operating Margin of Triangle Tire, 2013-2019
Output of Triangle Tire, 2013-2019
Capacity under Construction of Triangle Tire, 2019
Output Structure of Triangle Tire (by Application), 2018
Output Structure of Triangle Tire (by Product), 2018
Replacement & OE Revenue and Percentage of Triangle Tire, 2013-2018
All-steel Tire Revenue and Gross Margin of Triangle Tire, 2013-2018
Distribution of Triangle Tire’s Subsidiaries
Tire Brands of Linglong Tire
Revenue and Operating Margin of Linglong Tire, 2008-2019
Output of Linglong Tire, 2008-2019
Revenue of Linglong Tire (by Region), 2013-2018
Customers of Linglong Tire in China
Overseas Customers of Linglong Tire
Revenue Structure of Linglong Tire by Channel, 2018
Capacity, Output and Sales Volume of Linglong Tire (by Product), 2013-2017
Distribution of Linglong Tire’s Subsidiaries
Linglong Tire’s Major Projects under Construction, 2019
Revenue and Operating Margin of Aeolus Tire, 2006-2018
Output and Sales Volume of Aeolus Tire, 2014-2018
Output Structure of Aelus Tire by Product, 2018
Organizational Structure of Aeolus Tire
Revenue and Operating Margin of Double Coin, 2005-2014
Revenue and Operating Margin of Shanghai Huayi Group, 2013-2018
Output of Double Coin (by Product), 2010-2015
Output and Sales Volume of Shanghai Huayi Group, 2016-2018
Capacity under Construction of Shanghai Huayi Group, 2019
Revenue and Operating Margin of Jiangsu General Science Technology, 2013-2018
Tire Output and Sales Volume of Jiangsu General Science Technology, 2016-2019
Revenue and Structure of Jiangsu General Science Technology (by Product), 2013-2018
Tire Capacity under Construction of Jiangsu General Science Technology, 2019
Bias Tire Revenue Structure of Jiangsu General Science Technology (by Region), 2018
Equity Structure of Jiangsu General Science Technology
Revenue and Operating Margin of Guizhou Tire, 2008-2018
Tire Output of Guizhou Tire by Type, 2013-2018
Tire Output and Sales Volume of Guizhou Tire, 2013-2018
Sales Volume Structure of Guizhou Tire (by Product), 2018
Export Volume and Value of Guizhou Tire, 2013-2018
Revenue and Operating Margin of Qingdao Double Star, 2004-2018
Tire Capacity, Output and Sales Volume of Qingdao Double Star, 2013-2018
Export Volume and Value of Qingdao Double Star, 2013-2018
Xingyuan’s Revenue and Operating Margin, 2007-2018
Revenue and Operating Margin of Sailun Jinyu, 2009-2018
Revenue of Sailun Jinyu by Product, 2016-2018
Gross Margin of Sailun Jinyu by Product, 2013-2018
Tire Revenue of Sailun Jinyu (by Region),2013-2018
Tire Output and Sales Volume of Sailun Jinyu, 2016-2018
Projects under Construction of Sailun Jinyu, 2019
Production Base Distribution of Giti Tire
Brands under Giti Tire
Revene of Giti Tire Group, 2015-2018
Revenue and Operating Income of Giti Tire, 2008-2018
Output and Sales Volume of Giti Tire, 2018
Capacity under Construction of Giti Tire, 2018
Models Supported by Major Products of Giti Tire
Revenue of Prinx Chengshan (Shandong) Tire, 2015-2018
Revenue of Prinx Chengshan (Shandong) Tire by Region, 2017-2018
Revenue of Prinx Chengshan (Shandong) Tire by Product, 2017-2018
Global and China Leading Tier1 Suppliers’ Intelligent Cockpit Business Research Report, 2022 (II)
Tier1 Intelligent Cockpit Research: The mass production of innovative cockpits gathers pace, and penetration of new technologies is on a rapid riseGlobal OEMs and Tier 1 suppliers are racing for the i...
Global and China Leading Tier1 Suppliers’ Intelligent Cockpit Business Research Report, 2022 (I)
Tier1 Intelligent Cockpit Research: The mass production of innovative cockpits gathers pace, and penetration of new technologies is on a rapid riseGlobal OEMs and Tier 1 suppliers are racing for the i...
China Commercial Vehicle Intelligent Cockpit Industry Report 2021
Research on Intelligent Cockpits of Commercial Vehicles: Heading for Large Screens, Voice Interaction, Entertainment and Life
Following AD/ADAS functions, the intelligent configuration of the cockpit...
Automotive Ultra Wide Band (UWB) Industry Report, 2022
UWB got initially utilized in the military field, and began to be commercially applied after the release of criteria for UWB commercialization in 2002. In 2019, Car Connectivity Consortium (CCC) liste...
China Automotive Distribution and Aftermarket Industry Report, 2022-2027
Since the introduction of 4S store model into China at the end of 20th century, China's authorized dealer system has gradually developed from a single-store-based mode to a group-based mode, and from ...
Global and China Skateboard Chassis Industry Report, 2021-2022
Research into skateboard chassis: where to sell, how to sell and to whom it is sold
Rivian, a new carmaker based on skateboard chassis, is quite popular in the market and becomes the focus of the aut...
Emerging Automakers Strategy Research Report, 2022--NIO
Research on emerging carmaking strategies: no new cars in 2021, 3 new cars in 2022, can NIO make its renaissance?
The delivery of ET7 is imminent, and the sluggish sales situation is expected to fade...
Automotive and 5G Industry Integration Development Report, 2022
Research on integration of vehicle and 5G: OEMs rush into mass production of 5G models whose sales may reach 3.68 million units in 2025
By the end of 2021, China had built and opened in excess of 1.3...
China Automotive Finance Industry Report, 2022-2030
Auto finance is lucrative with the highest profit margin in the international automobile industry chain, contributing to roughly 23% of the global automobile industry profits. Yet, auto finance only h...
Global and China Power Battery Management System (BMS) Industry Report, 2022-2026
1. Robust demand from new energy vehicle spurs BMS market to boom
New energy vehicle sales have been growing rapidly worldwide over the recent years, reaching 6.5 million units with a year-on-year up...
ADAS/AD Chip Industry Research Report, 2022
Autonomous driving chip research: In addition to computing power, core IP, software stacks, AI training platforms, etc. are becoming more and more importantL2.5 and L2.9 have achieved mass production ...
Automotive Sensor Chip Industry Research Report, 2022
Sensor Chip Research: Automotive Sensors Have Entered a Technology Iteration Cycle, and Opportunities for Localization of Chips Are Coming Automotive sensor chips can obtain external environment ...
Automotive Cloud Service Platform Industry Report, 2021-2022
Research on Automotive Cloud Services: Based on 5ABCD, cloud services run through the R&D, production, sale, management and services of automakersWith the development of intelligent connectivity, ...
Global and China Cobalt Industry Report, 2021-2026
As a very rare metal and an important strategic resource for a country, cobalt gets typically utilized in battery materials, super heat-resistant alloys, tool steels, cemented carbides, and magnetic m...
Automotive Event Data Recorder (EDR) Industry Report, 2022
An event data recorder (EDR), sometimes referred to informally as an automotive black box, is a device or a system installed in vehicle to monitor, collect and record technical vehicle data and occupa...
Commercial Vehicle ADAS Industry Report, 2021
ResearchInChina has published the "Commercial Vehicle ADAS Industry Report, 2021", focusing on policy climate, ADAS installations, suppliers, etc., and with a deep dive into the prospects of Chinese c...
Automotive High-precision Positioning Research Report, 2022
High-precision Positioning Research: from L2+ to L3, high-precision integrated navigation and positioning will become the standard
With the development and progress of the autonomous driving industry...
China Around View System (AVS) Suppliers and Technology Trends Report, 2021 –Joint Venture Automakers
Research into JV automakers’ around view system: large-scale implementation of AVP is round the corner, and AVS vendors are energetically pushing ahead with parking fusion solution.
During January to...