China Bus Industry Report, 2017-2021
-
Aug.2017
- Hard Copy
- USD
$2,700
-
- Pages:115
- Single User License
(PDF Unprintable)
- USD
$2,500
-
- Code:
ZJF107
- Enterprise-wide License
(PDF Printable & Editable)
- USD
$3,900
-
- Hard Copy + Single User License
- USD
$2,900
-
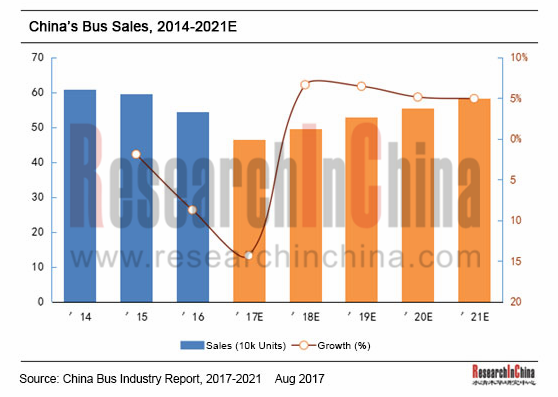
China bus industry has entered a period of adjustment in recent years following a phase of rapid growth with bus output and sales presenting downward trends (a year-on-year fall of 7.4% and 8.7% in 2016 and 15.3% and 14.0% in the first half of 2017, respectively). Over the next couple of years, the bus market may well decline due to smaller new energy vehicle subsidies, higher technical barriers and competition from high-speed rail; however, urban bus network and alternative demand from new energy vehicles can still provide some impetus to the bus industry. Hence, the country’s output and sales of bus are expected to reach 572,400 units and 582,700 units in 2021, representing a CAGR of 0.9% and 1.4% over 2016, respectively.
?
Market structure: Large and medium-sized buses grew rapidly while light bus fell at a faster rate in 2016. The output and sales of large bus were 90,200 units and 90,400 units, up 5.23% and 6.91% year on year, respectively; for medium-sized bus, 99,000 units were produced and 99,400 units sold, a 26.60% and 26.07% rise over the previous year separately; regarding light bus, 357,700 units were produced and 353,600 units sold, down 16.22% and 18.14% from a year ago individually. The bus market slid across the board in the first half of 2017 with the output and sales of large bus going down 18.26% and 17.38% to 28,500 units and 27,900 units respectively, of medium-sized bus down 37.54% and 36.36% to both 26,000 units, and of light bus down 9.71% and 8.32% to 164,200 units and 166,500 units separately, all on year-on-year basis.
Competitive landscape: relatively stable but highly concentrated. In 2016, top10 bus makers seized a combined market share of 71.47% and top5 ones 49.58%. With complete product lines (large, medium-sized and light buses), Yutong Bus and Xiamen King Long Motor Group retained the top spots, while JMC, Shenyang Jinbei Automotive and Beiqi Foton Motor, by virtue of their numerical advantage of light bus, joined the top5 positions.
China Bus Industry Report, 2017-2021 highlights the following:
 Overview of the bus industry (definition & classification, development trends, industry policies, etc.);
Overview of the bus industry in China (output & sales, ownership, etc.);
Bus market segments (large, medium-sized and light buses) (output & sales, competitive landscape, etc.);
Chinese new energy bus market (output & sales, competitive landscape, industry policies, etc.);
Bus industry chain in China (raw material markets, application markets, etc.);
16 makers including Yutong Bus, Zhongtong Bus, Xiamen King Long Motor Group, Dongfeng Automobile, Beiqi Foton Motor, JMCG and JAC (profile, financial position, output & sales, hit products, production bases, latest developments, etc.).
1 Industry Overview
1.1 Introduction to Product
1.2 Product Classification
1.3 Policies
1.4 Active Safety and Connected Car
1.4.1 Policy and Planning
1.4.2 Technical Standards
1.4.3 Enterprises’ Layout
2 Chinese Bus Market
2.1 Market Size
2.2 Market Structure
2.3 Competitive Landscape
2.3.1 Market Share
2.3.2 Performance Comparison
2.4 Market Segments
2.4.1 Coach
2.4.2 Public Bus
2.4.3 School Bus
2.5 Natural-gas Bus
3 Chinese Bus Market Segments
3.1 Large Bus
3.1.1 Market Size
3.1.2 Competitive Landscape
3.2 Medium-sized Bus
3.2.1 Market Size
3.2.2 Competitive Landscape
3.3 Light Bus
3.3.1 Market Size
3.3.2 Competitive Landscape
4 New Energy Bus Market
4.1 Market Size
4.2 Competitive Landscape
4.3 Industry Policies
4.3.1 Policies on Fiscal Subsidies
4.3.2 Policy of Cutting Subsidies for Diesel Oil and Increasing Subsidies for Electric Bus
4.3.3 Promotion and Assessment Methods
4.4 Technical Routes
4.5 Fuel-cell Bus
5 Bus Market Industry Chain
5.1 Upstream Raw Material Market
5.2 Key Components
5.2.1 Transmission
5.2.2 Wheel
5.2.3 New Energy Battery
5.3 Downstream Demand Market
5.3.1 Passenger Transport
5.3.2 High-speed Rail
5.3.3 Tourism
6 Major Enterprises
6.1 Zhengzhou Yutong Bus Co., Ltd.
6.1.1 Profile
6.1.2 Financial Position
6.1.3 Operating Revenue Structure
6.1.4 Output and Sales
6.1.5 New Energy Bus
6.1.6 Production Capacity
6.1.7 R&D Costs
6.1.8 Cost Structure
6.1.9 Components & Parts
6.1.10 Developments
6.1.11 Operational Prospects
6.2 Xiamen King Long Motor Group
6.2.1 Profile
6.2.2 Financial Position
6.2.3 Operating Revenue Structure
6.2.4 Operation of Major Subsidiaries
6.2.5 Output and Sales
6.2.6 New Energy Bus
6.2.7 Production Capacity
6.2.8 R&D Costs
6.2.9 Cost Structure
6.2.10 Developments
6.2.11 Operational Prospects
6.3 Zhongtong Bus and Holding Co., Ltd.
6.3.1 Profile
6.3.2 Financial Position
6.3.3 Operating Revenue Structure
6.3.4 Output and Sales
6.3.5 New Energy Bus
6.3.6 R&D Costs
6.3.7 Cost Structure
6.3.8 Developments
6.3.9 Operational Prospects
6.4 Beiqi Foton Motor Co., Ltd.
6.4.1 Profile
6.4.2 Financial Position
6.4.3 Operating Revenue Structure
6.4.4 Output and Sales
6.4.5 New Energy Bus
6.4.6 Production Capacity
6.4.7 R&D Costs
6.4.8 Operational Prospects
6.5 Anhui Ankai Automobile Co., Ltd.
6.5.1 Profile
6.5.2 Financial Position
6.5.3 Operating Revenue Structure
6.5.4 Output and Sales
6.5.5 New Energy Bus
6.5.6 Production Capacity
6.5.7 R&D Costs
6.5.8 Cost Structure
6.6 Liaoning SG Automotive Group Co., Ltd.
6.6.1 Profile
6.6.2 Financial Position
6.6.3 Operating Revenue Structure
6.6.4 Output and Sales
6.6.5 New Energy Business
6.6.6 Cost Structure
6.7 Yangzhou Asiastar Bus Co., Ltd.
6.7.1 Profile
6.7.2 Financial Position
6.7.3 Operating Revenue Structure
6.7.4 Output and Sales
6.7.5 New Energy Bus
6.7.6 R&D Costs
6.7.7 Cost Structure
6.8 BYD
6.8.1 Profile
6.8.2 Financial Position
6.8.3 Operating Revenue Structure
6.8.4 Output and Sales
6.8.5 New Energy Bus
6.8.6 Developments
6.9 Anhui Jianghuai Automobile Co., Ltd.
6.9.1 Profile
6.9.2 Financial Position
6.9.3 Operating Revenue Structure
6.9.4 Output and Sales
6.9.5 R&D Costs
6.9.6 Cost Structure
6.9.7 Operational Prospects
6.10 Shenyang Jinbei Automotive Co., Ltd.
6.10.1 Profile
6.10.2 Financial Position
6.10.3 Operating Revenue Structure
6.10.4 Output and Sales
6.10.5 R&D Costs
6.10.6 Cost Structure
6.10.7 Operational Prospects
6.11 Jiangling Motors Co., Ltd.
6.11.1 Profile
6.11.2 Financial Position
6.11.3 Operating Revenue Structure
6.11.4 Output and Sales
6.11.5 R&D Costs
6.11.6 Operational Prospects
6.12 Dongfeng Motor Corporation
6.12.1 Profile
6.12.2 Financial Position
6.12.3 Operating Revenue Structure
6.12.4 Output and Sales
6.12.5 R&D Costs
6.12.6 Cost Structure
6.12.7 Operational Prospects
Intelligent Operational Systems of Major Bus Enterprises in China
China’s Bus Output and Sales, 2005-2021E
Chinese Bus Market Structure, 2005-2021E
Top10 Bus Enterprises in China, 2014
Top10 Bus Enterprises in China, 2015
Top10 Bus Enterprises in China, 2016
Top10 Bus Enterprises in China, 2017
Revenue of Major Bus Enterprises in China, 2014-2017
Net Income of Major Bus Enterprises in China, 2014-2017
Gross Margin of Major Bus Enterprises in China, 2014-2017
Bus Sales in China by Application, 2014-2016
Chinese Large and Medium-sized Coach Market Structure by Application, 2016
Public Bus Sales in China, 2014-2016
School Bus Sales in China, 2009-2016
Natural-gas Bus Sales in China, 2014-2017
Large Bus and Chassis Output in China, 2005-2021E
Large Bus and Chassis Sales in China, 2005-2021E
Top10 Large Bus Makers in China, 2014
Market Share of Large Bus Chassis Enterprises in China, 2014
Top10 Large Bus Makers in China, 2015
Market Share of Large Bus Chassis Enterprises in China, 2015
Top10 Large Bus Makers in China, 2016
Market Share of Large Bus Chassis Enterprises in China, 2016
Top10 Large Bus Makers in China, 2017
Market Share of Large Bus Chassis Enterprises in China, 2017
Medium-sized Bus and Chassis Output in China, 2005-2021E
Medium-sized Bus and Chassis Sales in China, 2005-2021E
Top10 Medium-sized Bus Makers in China, 2014
Market Share of Medium-sized Bus Chassis Enterprises in China, 2014
Top10 Medium-sized Bus Makers in China, 2015
Market Share of Medium-sized Bus Chassis Enterprises in China, 2015
Top10 Medium-sized Bus Makers in China, 2016
Market Share of Medium-sized Bus Chassis Enterprises in China, 2016
Top10 Medium-sized Bus Makers in China, 2017
Market Share of Medium-sized Bus Chassis Enterprises in China, 2017
Light Bus and Chassis Output in China, 2005-2021E
Light Bus and Chassis Sales in China, 2005-2021E
Top10 Light Bus Makers in China, 2014
Market Share of Light Bus Chassis Enterprises in China, 2014
Top10 Light Bus Makers in China, 2015
Market Share of Light Bus Chassis Enterprises in China, 2015
Top10 Light Bus Makers in China, 2016
Market Share of Light Bus Chassis Enterprises in China, 2016
Top10 Light Bus Makers in China, 2017
Market Share of Light Bus Chassis Enterprises in China, 2017
New Energy Bus Output in China, 2016-2017
Top20 New Energy Bus Makers in China by Output, 2016-2017
Top20 Battery Electric Bus Makers in China by Output, 2016-2017
Top20 Plug-in Hybrid Bus Makers in China by Output, 2016-2017
Subsidy Standards for Electric Bus, 2017
Raw Material Costs of Major Bus Makers in China, 2014-2016
Market Share of Major Commercial Vehicle Transmission Producers in China
Major Suppliers of Commercial Vehicle Transmission in China
Wheel Hub Suppliers of Major Bus Makers in China
Highway Passenger Transportation in China, 2004-2017
High-speed Rail Mileage in China, 2013-2016
Total Tourism Revenue in China, 2001-2016
Number of Tourists during the Chinese Golden Week Holiday, 2008-2017
Main Financial Indicators of Yutong Bus, 2012-2017
Operating Revenue Structure of Yutong Bus by Business, 2013-2016
Operating Revenue Structure of Yutong Bus by Region, 2013-2016
Output and Sales of Yutong Bus by Product, 2012-2017
Sales Structure of Yutong Bus, 2015-2016
New Energy Bus Output of Yutong Bus, 2014-2017
New Energy Bus Sales of Yutong Bus, 2012-2016
New Energy Bus Sales of Yutong Bus by Type, 2015-2016
R&D Costs of Yutong Bus, 2009-2016
Product Cost Structure of Yutong Bus, 2014-2016
Revenue, Net Income, and Gross Margin of Yutong Bus, 2015-2021E
Main Financial Indicators of Xiamen King Long Motor Group, 2012-2017
Operating Revenue and Gross Margin of Xiamen King Long Motor Group's Major Products, 2015-2016
Operating Revenue Structure of Xiamen King Long Motor Group by Region, 2013-2016
Revenue and Net Income of Major Subsidiaries of Xiamen King Long Motor Group, 2014-2016
Bus Output of Subsidiaries of Xiamen King Long Motor Group, 2012-2017
Bus Sales of Subsidiaries of Xiamen King Long Motor Group, 2012-2017
Truck Output and Sales of Xiamen King Long Motor Group, 2012-2017
New Energy Bus Output of Xiamen King Long Motor Group, 2014-2017
New Energy Bus Sales of Xiamen King Long Motor Group by Length, 2015-2016
New Energy Bus Sales of Xiamen King Long Motor Group by Application, 2015-2016
Percentage of Key Parts Purchased by Xiamen King Long Motor Group for New Energy Bus
R&D Costs of Xiamen King Long Motor Group, 2010-2016
Cost Structure of Xiamen King Long Motor Group, 2013-2016
Revenue, Net Income, and Gross Margin of Xiamen King Long Motor Group, 2015-2021E
Main Financial Indicators of Zhongtong Bus, 2012-2017
Operating Revenue Structure of Zhongtong Bus by Business, 2013-2016
Operating Revenue Structure of Zhongtong Bus by Region, 2013-2016
Output and Sales of Zhongtong Bus, 2012-2017
New Energy Bus Output of Zhongtong Bus, 2014-2017
R&D Costs of Zhongtong Bus, 2012-2016
Cost Structure of Zhongtong Bus, 2013-2016
Revenue, Net Income, and Gross Margin of Zhongtong Bus, 2015-2021E
Main Financial Indicators of Beiqi Foton Motor, 2010-2017
Operating Revenue Structure of Beiqi Foton Motor by Business, 2014-2016
Operating Revenue Structure of Beiqi Foton Motor by Region, 2013-2016
Bus Output and Sales of Beiqi Foton Motor by Type, 2012-2017
New Energy Bus Output of Beiqi Foton Motor, 2014-2017
New Energy Bus Sales of FOTON AUV, 2013-2016
R&D Costs of Beiqi Foton Motor, 2010-2016
Revenue, Net Income, and Gross Margin of Beiqi Foton Motor, 2015-2021E
Financial Indicators of Anhui Ankai Automobile, 2012-2017
Operating Revenue Structure of Anhui Ankai Automobile by Business, 2015-2016
Operating Revenue Structure of Anhui Ankai Automobile by Region, 2013-2016
Output and Sales of Anhui Ankai Automobile, 2012-2017
New Energy Bus Output of Anhui Ankai Automobile, 2014-2017
R&D Costs of Anhui Ankai Automobile, 2010-2016
Cost Structure of Anhui Ankai Automobile, 2015-2016
Financial Indicators of SG Automotive Group, 2012-2017
Operating Revenue Structure of SG Automotive Group by Business, 2013-2016
Operating Revenue Structure of SG Automotive Group by Region, 2013-2016
Huanghai Bus Output and Sales Volume of SG Automotive Group, 2012-2017
Huanghai New Energy Bus Output of SG Automotive Group, 2014-2017
Cost Structure of SG Automotive Group, 2014-2016
Financial Indicators of Asiastar Bus, 2012-2017
Operating Revenue Structure of Asiastar Bus by Business, 2013-2016
Operating Revenue Structure of Asiastar Bus by Region, 2013-2015
Output and Sales of Asiastar, 2012-2017
New Energy Bus Sales Volume of Asiastar, 2014-2016
Asiastar’s Income from New Energy Bus Subsidies, 2015-2016
R&D Costs of Asiastar, 2010-2016
Cost Structure of Asiastar, 2014-2016
Financial Indicators of BYD, 2012-2017
Operating Revenue Structure of BYD by Business, 2013-2016
Operating Revenue Structure of BYD by Region, 2015-2016
Bus Output and Sales Volume of BYD, 2012-2017
Main New Energy Buses of BYD
Capacity and Output of BYD’s Major New Energy Bus Bases, 2016
Key Orders of BYD, 2016
Financial Indicators of JAC, 2012-2017
Operating Revenue Structure of JAC by Business, 2015-2016
Operating Revenue Structure of JAC by Region, 2013-2016
Bus Output and Sales of JAC, 2012-2017
R&D Costs of JAC, 2010-2016
Cost Structure of JAC, 2016
Revenue, Net Income, and Gross Margin of JAC, 2014-2021E
Financial Indicators of Jinbei Auto, 2012-2017
Operating Revenue Structure of Jinbei Auto by Business, 2013-2016
Operating Revenue Structure of Jinbei Auto by Region, 2013-2016
Commercial Vehicle Output and Sales of Jinbei Auto, 2012-2017
R&D Costs of Jinbei Auto, 2012-2016
Cost Structure of Jinbei Auto, 2014-2016
Revenue, Net Income, and Gross Margin of Jinbei Auto, 2015-2021E
Financial Indicators of JMC, 2012-2017
Operating Revenue Structure of JMC by Business, 2013-2016
Bus Output and Sales of JMC, 2012-2017
R&D Costs of JMC, 2010-2016
Revenue, Net Income, and Gross Margin of JMC, 2015-2021E
Financial Indicators of Dongfeng Motor, 2012-2017
Operating Revenue Structure of Dongfeng Motor by Business, 2013-2016
Operating Revenue Structure of Dongfeng Motor by Region, 2013-2016
Bus Output and Sales of Dongfeng Motor, 2012-2017
R&D Costs of Dongfeng Motor, 2010-2016
Cost Structure of Dongfeng Motor, 2014-2016
Revenue, Net Income, and Gross Margin of Dongfeng Motor, 2015-2021E
Bus Output and Sales of SAIC MAXUS, 2012-2017
Capacity of SAIC MAXUS (including New Energy), 2016
Ongoing Projects of SAIC MAXUS, 2016
New Energy Vehicle Output, Sales Volume, and Revenue of SAIC MAXUS, 2015-2016
Global and China Leading Tier1 Suppliers’ Intelligent Cockpit Business Research Report, 2022 (II)
Tier1 Intelligent Cockpit Research: The mass production of innovative cockpits gathers pace, and penetration of new technologies is on a rapid riseGlobal OEMs and Tier 1 suppliers are racing for the i...
Global and China Leading Tier1 Suppliers’ Intelligent Cockpit Business Research Report, 2022 (I)
Tier1 Intelligent Cockpit Research: The mass production of innovative cockpits gathers pace, and penetration of new technologies is on a rapid riseGlobal OEMs and Tier 1 suppliers are racing for the i...
China Commercial Vehicle Intelligent Cockpit Industry Report 2021
Research on Intelligent Cockpits of Commercial Vehicles: Heading for Large Screens, Voice Interaction, Entertainment and Life
Following AD/ADAS functions, the intelligent configuration of the cockpit...
Automotive Ultra Wide Band (UWB) Industry Report, 2022
UWB got initially utilized in the military field, and began to be commercially applied after the release of criteria for UWB commercialization in 2002. In 2019, Car Connectivity Consortium (CCC) liste...
China Automotive Distribution and Aftermarket Industry Report, 2022-2027
Since the introduction of 4S store model into China at the end of 20th century, China's authorized dealer system has gradually developed from a single-store-based mode to a group-based mode, and from ...
Global and China Skateboard Chassis Industry Report, 2021-2022
Research into skateboard chassis: where to sell, how to sell and to whom it is sold
Rivian, a new carmaker based on skateboard chassis, is quite popular in the market and becomes the focus of the aut...
Emerging Automakers Strategy Research Report, 2022--NIO
Research on emerging carmaking strategies: no new cars in 2021, 3 new cars in 2022, can NIO make its renaissance?
The delivery of ET7 is imminent, and the sluggish sales situation is expected to fade...
Automotive and 5G Industry Integration Development Report, 2022
Research on integration of vehicle and 5G: OEMs rush into mass production of 5G models whose sales may reach 3.68 million units in 2025
By the end of 2021, China had built and opened in excess of 1.3...
China Automotive Finance Industry Report, 2022-2030
Auto finance is lucrative with the highest profit margin in the international automobile industry chain, contributing to roughly 23% of the global automobile industry profits. Yet, auto finance only h...
Global and China Power Battery Management System (BMS) Industry Report, 2022-2026
1. Robust demand from new energy vehicle spurs BMS market to boom
New energy vehicle sales have been growing rapidly worldwide over the recent years, reaching 6.5 million units with a year-on-year up...
ADAS/AD Chip Industry Research Report, 2022
Autonomous driving chip research: In addition to computing power, core IP, software stacks, AI training platforms, etc. are becoming more and more importantL2.5 and L2.9 have achieved mass production ...
Automotive Sensor Chip Industry Research Report, 2022
Sensor Chip Research: Automotive Sensors Have Entered a Technology Iteration Cycle, and Opportunities for Localization of Chips Are Coming Automotive sensor chips can obtain external environment ...
Automotive Cloud Service Platform Industry Report, 2021-2022
Research on Automotive Cloud Services: Based on 5ABCD, cloud services run through the R&D, production, sale, management and services of automakersWith the development of intelligent connectivity, ...
Global and China Cobalt Industry Report, 2021-2026
As a very rare metal and an important strategic resource for a country, cobalt gets typically utilized in battery materials, super heat-resistant alloys, tool steels, cemented carbides, and magnetic m...
Automotive Event Data Recorder (EDR) Industry Report, 2022
An event data recorder (EDR), sometimes referred to informally as an automotive black box, is a device or a system installed in vehicle to monitor, collect and record technical vehicle data and occupa...
Commercial Vehicle ADAS Industry Report, 2021
ResearchInChina has published the "Commercial Vehicle ADAS Industry Report, 2021", focusing on policy climate, ADAS installations, suppliers, etc., and with a deep dive into the prospects of Chinese c...
Automotive High-precision Positioning Research Report, 2022
High-precision Positioning Research: from L2+ to L3, high-precision integrated navigation and positioning will become the standard
With the development and progress of the autonomous driving industry...
China Around View System (AVS) Suppliers and Technology Trends Report, 2021 –Joint Venture Automakers
Research into JV automakers’ around view system: large-scale implementation of AVP is round the corner, and AVS vendors are energetically pushing ahead with parking fusion solution.
During January to...