China Commercial Vehicle Industry Report, 2021-2026
-
Jan.2022
- Hard Copy
- USD
$3,400
-
- Pages:175
- Single User License
(PDF Unprintable)
- USD
$3,200
-
- Code:
ZJF181
- Enterprise-wide License
(PDF Printable & Editable)
- USD
$4,800
-
- Hard Copy + Single User License
- USD
$3,600
-
In terms of design and technical characteristics, commercial vehicles are used to transport people and goods. Commercial vehicles include trucks and buses with more than 9 seats, so in general, commercial vehicles can be divided into two categories: buses and trucks. In recent years, driven by trucks, China's commercial vehicle market has grown rapidly. Despite the COVID -19 pandemic, China's commercial vehicle industry saw five consecutive years of growth in 2020, particularly heavy trucks, medium trucks and micro trucks all achieved double-digit growth.
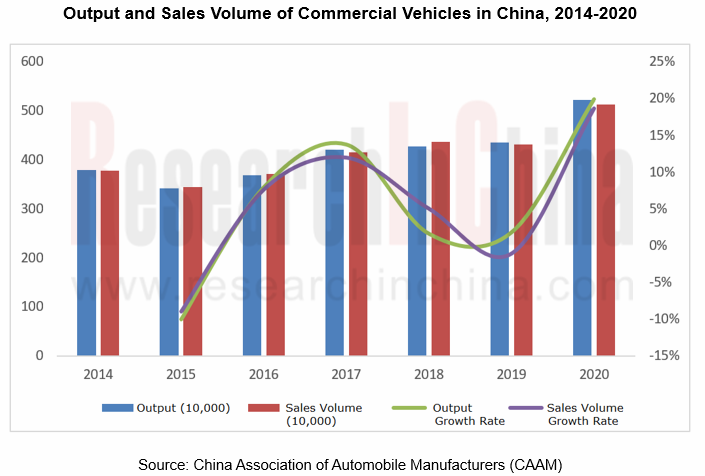
From the perspective of the output and sales volume of specific models, trucks are the main models that support the constant and high growth of commercial vehicles, especially heavy and light trucks contribute significantly to the growth. In 2020, China sold 1.6194 million heavy trucks, 159,000 medium trucks, 2.1978 million light trucks, and 708,400 minivans. Due to the COVID-19 pandemic, the cumulative sales volume of buses in China fell sharply to 448,200 units in 2020, down 5.58% from 2019. The domestic market continues to be sluggish, and the market demand is saturated.
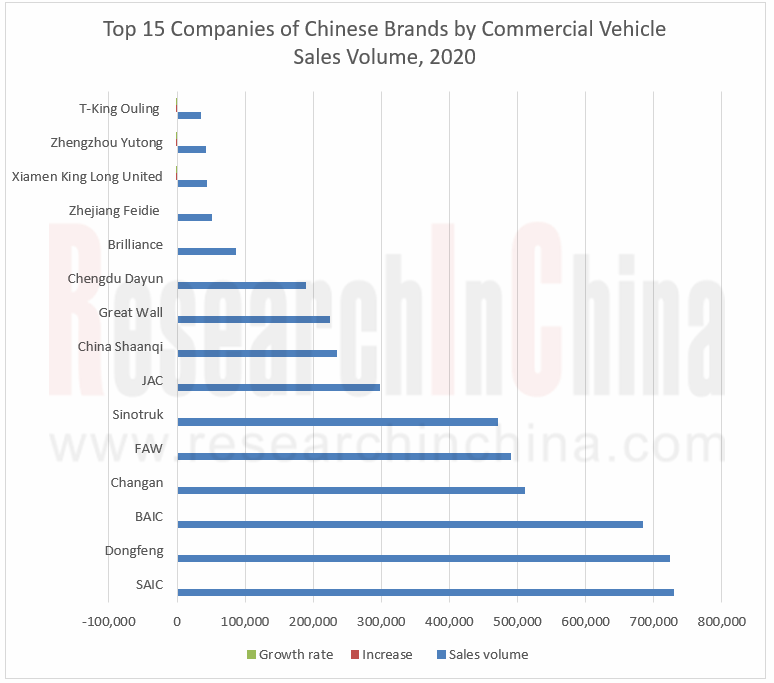
As for the competitive landscape, the top ten Chinese commercial vehicle companies by sales volume include SAIC, Dongfeng Motor, BAIC, Changan Automobile, China FAW, Sinotruk, JAC, China Shaanqi, Great Wall Motor and Chengdu Dayun Automobile. Among them, SAIC ranks first in sales volume with nearly 729,000 units cumulatively, while Sinotruk ranks first in growth with the cumulative sales volume of 471,000 units, followed by Great Wall with 225,000 units and China FAW with 490,000 units.
By sales volume, the top ten bus manufacturers --- JMC, SAIC MAXUS, Beiqi Foton, Zhengzhou Yutong, Changan Automobile, Nanjing Iveco, Xiamen King Long United, Xiamen Golden Dragon Bus, Zhongtong Bus and Brilliance Renault sold 91,100 units, 59,700 units, 42,700 units, 41,800 units, 38,700 units, 28,400 units, 20,300 units, 16,300 units, 10,800 units and 10,400 units in 2020 respectively. Compared with the previous year, the market performance of the top three companies was more prominent, and their sales volume soared year-on-year, particularly SAIC MAXUS saw a more significant growth rate, Nanjing Iveco also secured the growth rate of more than 10%, while the other six companies represented by Brilliance Renault suffered decline.
The top ten truck manufacturers by sales volume in 2020---Dongfeng Motor, Beiqi Foton, SAIC-GM-Wuling, FAW, Sinotruk, JAC, Changan Automobile, China Shaanqi, Great Wall Motor and JMC sold 647,800 units, 600,400 units, 504,500 units, 489,300 units, 470,300 units, 281,400 units, 236,300 units, 235,100 units, 225,000 units and 194,100 units respectively. Among them, Dongfeng Motor, Beiqi Foton, FAW, Sinotruk and SAIC focused on heavy trucks, SAIC-GM-Wuling centered on micro trucks, and others were based on light trucks.
The expected trends in the commercial vehicle market in the future mainly include: the performance of traditional fuel vehicles will be improved quickly, and the upgrade and iteration are mainly reflected in automation, lightweight, energy saving, comfort, safety and environmental protection; the load and power of vehicles will increase; the current models with displacement of 11L and 13L will transition to 15L and 16L during the "14th Five-Year Plan" period; among battery-electric models, the development of heavy trucks will accelerate, especially the benefits of battery-electric models are significantly more than those of fuel vehicles in fixed scenarios and conditions; intelligent and autonomous driving have just be practically used in the field of commercial vehicles.
China Commercial Vehicle Industry Report, 2021-2026 highlights the followings:
 Bus industry overview (definition, classification, development trend, industrial policy, etc.);
Overall development of China bus industry (output, sales volume, ownership, etc.);
Overview of bus market segments in China, including large bus, medium bus and Small Bus (output, sales volume, competitive pattern, etc.);
China new energy bus market (output, sales volume, competitive pattern, industrial policy, etc.);
Bus industry chain in China, involving raw materials market, downstream application market, etc.;
Overview of truck industry in China (product definition, classification, technology source, latest policy, development orientation, etc.);
Status quo of China truck industry (ownership, output, sales volume, market structure, import & export, competitive pattern, etc.);
Overview of truck market segments in China, covering heavy truck, medium truck, light truck and mini truck (output, sales volume, competitive pattern, etc.);
Truck industry chain in China, involving raw materials market, downstream application market, etc.;
16 commercial vehicle manufacturers (like Yutong Bus, Zhongtong Bus, King Long Motor, FAW Group, Dongfeng Motor Corporation, Sinotruk, Foton, JMC, JAC), including profile, financial situation, output, sales volume, pillar products, distribution of production bases, latest news, etc.
1 Overview of Bus Industry
1.1 Introduction to Product
1.2 Product Classification
1.3 Policies
1.4 Commercial Vehicle Telematics
2. China Bus Market
2.1 Market Size
2.2 Market Structure
2.3 Competitive Landscape
2.3.1 Market Share
2.3.2 Performance Comparison
2.4 Main Market Segments
2.4.1 Coach
2.4.2 City Bus
2.4.3 School Bus
2.5 Natural Gas School Bus
3 Bus Market Segments in China
3.1 Large Bus
3.1.1 Market Size
3.1.2 Competitive Pattern
3.2 Medium Bus
3.2.1 Market Size
3.2.2 Competitive Pattern
3.3 Small Bus
3.3.1 Market Size
3.3.2 Competitive Pattern
4 New Energy Bus Market
4.1 Market Size
4.2 Market Segments
4.3 Competitive Landscape
4.4 Supporting
4.5 Fuel Cell Bus
5 Bus Industry Chain
5.2 Main Parts
5.2.1 Transmission
5.2.2 New Energy Battery
5.3 Downstream Demand
5.3.1 Passenger Transport
5.3.2 Substitution of HSR
5.3.3 Tourism
Part II Truck Industry
6 Overview of the Truck Industry
6.1 Definition and Classification
6.2 Technology Introduction
7 Truck Market
7.1 Ownership
7.2 Output and Sales Volume
7.2.1 Output
7.2.2 Sales Volume
7.3 Market Structure
7.4 Import and Export
7.5 Competitive Pattern
8 Truck Market Segments
8.1 Heavy-duty Truck
8.1.1 Output and Sales Volume
8.1.2 Competitive Pattern
8.2 Medium Truck
8.2.1 Output and Sales Volume
8.2.2 Competitive Pattern
8.3 Light Truck
8.3.1 Output and Sales Volume
8.3.2 Competitive Pattern
8.4 Mini Truck
8.4.1 Output and Sales Volume
8.4.2 Competitive Pattern
9 Truck Industry Chain
9.1 Overview of Industrial Chain
9.2 Key Components
9.2.1 Cost Structure
9.2.2 Supporting
9.3 Raw Materials Market
9.3.1 Iron & Steel
9.3.2 Rubber
9.4 Downstream Market
9.4.1 Infrastructure Construction
9.4.2 Real Estate Development
9.4.3 Highway Freight
Part III Companies
10. Companies
10.1 Yutong Bus
10.1.1 Profile
10.1.2 Financial Situation
10.1.3 Revenue Structure
10.1.4 Output and Sales
10.1.5 New Energy Bus
10.1.6 Production Capacity
10.1.7 R&D
10.2 Xiamen King Long Motor Group
10.2.1 Profile
10.2.2 Financial Situation
10.2.3 Revenue Structure
10.2.4 Operation of Key Subsidiaries
10.2.5 Output and Sales
10.2.6 New Energy Bus
10.2.7 Production Capacity
10.2.8 R&D Expenses
10.2.9 Autonomous Driving &intelligent connectivity
10.3 Zhongtong Bus
10.3.1 Profile
10.3.2 Financial Situation
10.3.3 Revenue Structure
10.3.4 Output and Sales
10.3.5 New Energy Bus
10.3.6 R&D Expenses
10.3.7 Autonomous Driving
10.4 Beiqi Foton Motor Co., Ltd.
10.4.1 Profile
10.4.2 Financial Situation
10.4.3 Revenue Structure
10.4.4 Output and Sales
10.4.5 New Energy Commercial Vehicle
10.4.7 Production Capacity
10.4.8 R&D Expenses
10.4.9 intelligent connectivity
10.5 Ankai Automobile
10.5.1 Profile
10.5.2 Financial Situation
10.5.3 Revenue Structure
10.5.4 Output and Sales
10.5.5 New Energy Bus
10.5.6 Production Capacity
10.5.7 R&D Expenses
10.5.8 Autonomous Driving
10.6 Liaoning SG Automotive Group Co., Ltd.
10.6.1 Profile
10.6.2 Financial Situation
10.6.3 Revenue Structure
10.6.4 Output and Sales
10.6.5 New Energy Business
10.7 Yangzhou Asiastar Bus Co., Ltd.
10.7.1 Profile
10.7.2 Financial Situation
10.7.3 Revenue Structure
10.7.4 Output and Sales
10.7.5 New Energy Bus
10.7.6 R&D Expenses
10.7.7 Autonomous Driving
10.8 BYD
10.8.1 Profile
10.8.2 Financial Situation
10.8.3 Revenue Structure
10.8.4 Output and Sales
10.8.5 Autonomous Driving
10.9 JAC
10.9.1 Profile
10.9.2 Financial Situation
10.9.3 Revenue Structure
10.9.4 Output and Sales
10.9.5 Capacity Distribution
10.9.6 R&D Expenses
10.9.7 Autonomous Driving
10.10 SINOTRUK
10.10.1 Profile
10.10.2 Operation
10.10.3 Heavy Truck Business
10.10.4 Autonomous Driving
10.11 Jiangling Motors Co., Ltd. (JMC)
10.11.1 Profile
10.11.2 Financial Situation
10.11.3 Revenue Structure
10.11.4 Output and Sales
10.11.5 R&D Expenses
10.11.6 Autonomous Driving
10.12 Dongfeng Motor Corporation
10.12.1 Profile
10.12.2 Financial Situation
10.12.3 Revenue Structure
10.12.4 Output and Sales
10.12.5 R&D Expenses
10.12.8 Autonomous Driving
10.13 SAIC Motor
10.13.1 Profile
10.13.2 Financial Situation
10.13.3 Revenue Structure
10.13.4 Output and Sales
10.13.5 SAIC MAXUS Automotive Co., Ltd.
10.13.6 Nanjing IVECO Automobile Co., Ltd.(NAVECO)
10.13.7 SAIC-IVECO Hongyan
10.13.8 SAIC GM Wuling (SGMW)
10.14 FAW Jiefang Automotive Co., Ltd.
10.14.1 Profile
10.14.2 Financial Situation
10.14.3 Revenue Structure
10.14.4 Production
10.14.5 Sales
10.14.6 New Energy Vehicle
10.14.7 New Format
10.15 Hanma Technology
10.15.1 Profile
10.15.2 Operation
10.15.3 Truck Business
10.15.4 Output and Sales
10.16 QingLing Motors (Group) Co., Ltd.
10.16.1 Profile
10.16.2 Operation
10.16.3 Truck Business
10.16.4 Autonomous Driving
Connectivity and Intelligence Comparison between Passenger Cars and Commercial Vehicle
Policies for Commercial Vehicle Telematics
OEM and AM Market Size Forecast of Commercial Vehicle Telematics in China
Market Space for Different Types of Commercial Vehicle Intelligent Equipment (Active Safety)
Output and Sales Volume of Bus in China, 2005-2020
Bus Market Structure in China, 2005-2020
TOP10 Bus Enterprises in China, 2020
Revenue of Major Bus Enterprises in China, 2019-2021
Net Income of Major Bus Enterprises in China, 2019-2021
Gross Margin of Major Bus Enterprises in China, 2019-2021
Sales Volume of Buses in China by Purpose, 2019-2020
coach Sales Volume by Type, 2019-2020
City Bus Sales Volume by Type, 2019-2020
Sales Volume of School Bus in China, 2019-2020
Output and Sales Volume of Natural Gas Bus in China, 2019-2020
Output of Large Bus and Chassis in China, 2005-2020
Sales Volume of Large Bus and Chassis in China, 2005-2020
Large Bus Output (including Incomplete Vehicles) in China, 2019-2020
Large Bus Sales Volume (including Incomplete Vehicles) in China, 2019-2020
Output of Medium Bus and Chassis in China, 2005-2020
Sales Volume of Medium Bus and Chassis in China, 2005-2020
Medium Bus Output (including Incomplete Vehicles) in China, 2019-2020
Medium Bus Sales Volume (including Incomplete Vehicles) in China, 2019-2020
Output of Small Bus and Chassis in China, 2005-2020
Sales Volume of Small Bus and Chassis in China, 2005-2020
Small Bus Output (including Incomplete Vehicles) in China, 2019-2020
Small Bus Sales Volume (including Incomplete Vehicles) in China, 2019-2020
Monthly New Energy Bus Sales Volume, 2018-2021
New Energy Bus Sales Volume by Type, 2018-2021
New Energy Bus Sales Volume by Application Field, 2018-2021
New Energy Bus Sales Volume, 2018-2021
New Energy Bus Power Battery, 2020
New Energy Bus motor, 2020
New Energy Bus Ranking by Installations of Drive Motors, 2020
Distribution of Major Hydrogen Fuel Cell Bus Manufacturers in China by Sales Volume, 2018-2021
Market Share of Major Commercial Vehicle Transmission Enterprises in China
Major Commercial Vehicle Transmission Suppliers in China
China’s Power Lithium Battery Manufacturers and Supported Models
Highway Passenger Transport in China, 2005-2020
Operating Mileage of High-speed Railways in China, 2013-2020
Total Tourism Revenue in China, 2010-2020
Truck (Freight Vehicle) Segments
Applications of Truck by Sector
Technology Introduction of Major Heavy Truck Manufacturers in China
Truck Ownership and Growth in China, 2015-2020
Structure of Truck Ownership in China, 2016-2020
Truck Tonnage and Growth in China, 2015-2020
Tonnage of Regular Trucks and Special Trucks in China, 2015-2020
Output of Trucks in China, 2010-2020
Sales Volume of Trucks in China, 2010-2020
Truck Output by Fuel in China, 2019-2020
Truck Output by Gross Weight in China, 2019-2020
Truck Output by Purpose in China, 2019-2020
Truck Import Volume and Value in China, 2016-2021
Truck Export Volume and Value in China, 2016-2021
Sales Volume and Market Share of TOP10 Truck Enterprises in China, 2020
Output of Heavy Truck in China, 2010-2020
Sales Volume of Heavy Truck in China, 2010-2020
Sales Volume of Heavy Truck Manufacturers in China, 2019-2020
Output of Heavy Truck Manufacturers in China, 2019-2020
Output of Medium Truck in China, 2010-2020
Sales Volume of Medium Truck in China, 2010-2020
Sales Volume of TOP Complete Medium Truck Enterprises in China, 2019-2020
Sales Volume of TOP Incomplete Medium Truck Enterprises in China, 2019-2020
Output of Complete Light Truck in China, 2010-2020
Sales Volume of Light Truck in China, 2010-2020
Sales Volume of TOP Light Truck Enterprises in China, 2019-2020
Production Volume of TOP Light Truck Enterprises in China, 2019-2020
Output of Mini Truck in China, 2010-2020
Sales Volume of Mini Truck in China, 2010-2020
Output of Top Mini Truck Manufacturers in China, 2019-2020
Sales Volume of Top Mini Truck Manufacturers in China, 2019-2020
Automotive Industry Chain
Cost Structure of Truck Industry
Transmission Supply of Major Heavy Truck Manufacturers in China
China's Galvanized Sheet (Strip) Output and Sales Volume, 2016-2021
China's (Shanghai) Galvanized Coil Price, 2011-2021
China's Cold-rolled Thin Sheet Weekly Output, 2016-2021
China's (Shanghai) Cold-rolled Coil Price, 2015-2021
China's Natural Rubber Spot and Future Price, 2011-2021
China's Investment in Fixed Assets, 2010-2017
China's Investment in Real Estate Development, 2010-2020
China's New Housing Start Area and Sales Area, 2005-2020
China's Highway Freight Volume and Turnover, 2005-2020
Main Financial Indices of Zhengzhou Yutong Bus, 2016-2021
Operating Revenue Structure of Zhengzhou Yutong Bus by Business, 2020-2021
Operating Revenue Structure of Zhengzhou Yutong Bus by Region, 2019-2020
Output and Sales Volume of Zhengzhou Yutong Bus by Product, 2019-2021
Sales Volume of Zhengzhou Yutong Bus by Region, 2019-2020
Output of New Energy Bus of Zhengzhou Yutong Bus, 2017-2020
Sales Volume of New Energy Bus of Zhengzhou Yutong Bus, 2017-2020
Capacity Layout (Including New Energy Bus) of Zhengzhou Yutong Bus, 2020
R&D Costs of Zhengzhou Yutong Bus, 2016-2021
Key Financial Indicators of Xiamen King Long Motor Group, 2016-2021
Operating Revenue and Gross Margin of Xiamen King Long Motor Group's Major Products, 2019-2020
Operating Revenue Structure of Xiamen King Long Motor Group by Region, 2019-2020
Revenue and Net Income of Major Subsidiaries of Xiamen King Long Motor Group, 2019-2020
Bus Output and Sales Volume of Xiamen King Long Motor Group, 2019-2020
Sales Volume of Xiamen King Long Motor Group by Region, 2019-2020
New Energy Bus Output of Xiamen King Long Motor Group, 2017-2020
New Energy Bus Sales Volume of Xiamen King Long Motor Group, 2017-2020
New Energy Bus Sales of Xiamen King Long Motor Group by Length, 2019-2020
New Energy Bus Sales of Xiamen King Long Motor Group by Application, 2019-2020
Xiamen King Long Motor Group’s Capacity by Enterprise, 2020
R&D Costs of Xiamen King Long Motor Group, 2014-2020
Schematic of Apollo
Autonomous Driving of Apollo
Main Financial Indicators of Zhongtong Bus, 2016-2021
Operating Revenue Structure of Zhongtong Bus by Business, 2019-2020
Operating Revenue Structure of Zhongtong Bus by Region, 2019-2020
Output and Sales of Zhongtong Bus, 2019-2020
New Energy Bus Output of Zhongtong Bus, 2019-2020
Suppliers of New Energy Bus of Zhongtong Bus
R&D Costs of Zhongtong Bus, 2014-2021
L4 Autonomous Vehicles of Zhongtong Bus
Main Financial Indicators of Beiqi Foton Motor, 2010-2017
Revenue Structure of Beiqi Foton Motor by Business, 2019-2020
Revenue Structure of Beiqi Foton Motor by Region, 2019-2020
Bus Output and Sales of Beiqi Foton Motor by Type, 2019-2021
New Energy Bus Output and Sales of Beiqi Foton Motor, 2014-2021
Major Suppliers of New Energy Bus of Beiqi Foton Motor
New Energy Truck Output and Sales of Beiqi Foton Motor, 2016-2021
R&D Costs of Beiqi Foton Motor, 2014-2020
Autonomous Vehicles of Beiqi Foton Motor
Financial Indicators of Anhui Ankai Automobile, 2016-2021
Operating Revenue Structure of Anhui Ankai Automobile by Business, 2019-2020
Operating Revenue Structure of Anhui Ankai Automobile by Region, 2019-2020
Output and Sales of Anhui Ankai Automobile, 2019-2020
Core Suppliers for Electric Bus of Anhui Ankai Automobile
Capacity Layout of Bus (Including New Energy Bus) of Anhui Ankai Automobile, 2020
R&D Costs of Anhui Ankai Automobile, 2014-2020
Autonomous Vehicles of Anhui Ankai Automobile
Financial Indicators of SG Automotive Group, 2016-2021
Revenue Structure of SG Automotive Group by Business, 2019-2020
Revenue Structure of SG Automotive Group by Region, 2019-2020
Huanghai Bus Output and Sales Volume of SG Automotive Group, 2017-2020
Huanghai New Energy Bus Output of SG Automotive Group, 2015-2020
Financial Indicators of Asiastar Bus, 2016-2021
Operating Revenue Structure of Asiastar Bus by Business, 2019-2020
Operating Revenue Structure of Asiastar Bus by Region, 2019-2020
Output and Sales of Asiastar, 2017-2020
Sales Distribution of Asiastar by Region, 2019-2020
New Energy Bus Sales Volume of Asiastar, 2017-2020
Asiastar’s Income from New Energy Bus Subsidies, 2018-2020
R&D Costs of Asiastar, 2012-2020
Autonomous Commercial Vehicles of Asiastar
Financial Indicators of BYD, 2016-2021
Revenue Structure of BYD by Business, 2019-2021
Revenue Structure of BYD by Region, 2019-2021
New Energy Vehicle Output and Sales Volume of BYD, 2019-2020
Main New Energy Buses of BYD
Financial Indicators of JAC, 2016-2021
Revenue Structure of JAC by Business, 2019-2020
Revenue Structure of JAC by Region, 2019-2020
JAC’s Commercial Vehicle Output and Sales Volume, 2019-2020
Truck Capacity Distribution of JAC, 2016
JAC’s R&D Expenses, 2014-2020
JAC HyperTruck One
Sinotruk’s Revenue and Net Income, 2014-2021
Sinotruk’s Gross Margin, 2014-2021
Sinotruk’s Revenue Structure by Business, 2020
Sinotruk’s Heavy Truck Product Family Genealogy
Sinotruk’s Main Product Configuration
Sinotruk’s Truck Output and Sales Volume, 2016-2020
HOWO T5G Electric Truck
Financial Indicators of JMC, 2016-2021
Revenue Structure of JMC by Business, 2019-2020
Commercial Vehicle Output and Sales of JMC, 2019-2020
R&D Costs of JMC, 2014-2020
JMC WeRide Robovan
Financial Indicators of Dongfeng Motor, 2016-2021
Revenue Structure of Dongfeng Motor by Business, 2019-2020
Revenue Structure of Dongfeng Motor by Region, 2019-2020
Commercial Vehicle Output and Sales of Dongfeng Motor, 2017-2021
Capacity and Utilization of Dongfeng Motor’s Main Products, 2020
New Energy Vehicle Capacity and Utilization of Dongfeng Motor, 2020
New Energy Vehicle Output and Sales Volume of Dongfeng Motor, 2017-2020
R&D Costs of Dongfeng Motor, 2014-2020
Autonomous Container Trucks of Dongfeng Motor,
Financial Indicators of SAIC Motor, 2016-2021
Revenue Structure of SAIC Motor by Business, 2019-2020
Revenue Structure of Dongfeng Motor by Region, 2019-2020
Commercial Vehicle Capacity of SAIC Motor, 2020
Commercial Vehicle Output and Sales of SAIC Motor, 2019-2020
Commercial Vehicle Sales of SAIC Motor by Region, 2019-2020
New Energy Vehicle Output and Sales Volume of SAIC Motor, 2019-2020
Commercial Vehicle Capacity Distribution of SAIC MAXUS
Vehicle Sales Volume of SAIC MAXUS, 2015-2021
Product Lineup of SAIC HONGYAN
Development History of SAIC GM Wuling
Main Trucks (Mini Trucks) of SAIC GM Wuling
Distribution of SAIC GM Wuling’s Production Bases
Domestic Business Layout of FAW Jiefang
Financial Indicators of FAW Jiefang, 2018-2021
Revenue Structure of FAW Jiefang by Business, 2019-2020
Revenue Structure of FAW Jiefang by Region, 2019-2020
Products of FAW Jiefang
Main Truck Manufacturing Bases of FAW Group
Commercial Vehicle Output and Sales of FAW Jiefang, 2019-2020
Sales Network of FAW Jiefang in China
Overseas Sales Network of FAW Jiefang
Medium and Heavy Truck Sales Volume of FAW Jiefang, 2016-2021
Light Truck Sales Volume of FAW Jiefang, 2016-2021
Automotive Power and ICV Layout of FAW Jiefang
New Energy Strategy of FAW Jiefang
New Format - Columbus Smart Logistics Open Plan of FAW Jiefang
Main Production Bases of Hanma Technology
Hanma Technology’s Assets and Net Income, 2012-2020
Revenue Structure of Hanma Technology by Business, 2019-2020
Hanma Technology’s Products Series
New Energy Vehicle Development History of Hanma Technology
New Energy Vehicles of Hanma Technology
Hanma Technology’s Truck Output and Sales Volume, 2019-2020
Hanma Technology’s Truck Sales at Home and Abroad, 2019-2020
Qingling Motors’ Revenue and Net Income, 2014-2021
Qingling Motors’ Gross Margin, 2013-2020
Qingling Motors’ Revenue Breakdown by Product, 2019-2020
Qingling Motors’ Output and Sales Volume, 2015-2020
Qingling Motors’ Electric Vehicles
Qingling Motors’ Hydrogen Fuel Vehicles
Qingling Motors’ L3 Autonomous Vehicles
Automotive DMS/OMS (Driver/Occupant Monitoring System) Research Report, 2022
In-cabin Monitoring Research: In the first nine months of 2022, the installations of DMS+OMS swelled by 130% yr-on-yr with visual DMS/OMS as the mainstream solution
Local manufacturers are keen to de...
NIO ET5/ET7 Intelligent Function Deconstructive Analysis Report, 2022
NIO ET5/ET7 Intelligent Function Deconstruction: R&D will change the market pattern in 2025Chinese automakers have triumphed remarkably in the field of high-end intelligent electric vehicles. Afte...
Automotive Smart Cockpit Design Trend Report, 2022
Research on design trends of intelligent cockpits: explore 3D, integrated interaction. ...
Commercial Vehicle Telematics Report, 2022
Commercial vehicle telematics research: three parties make efforts to facilitate the industrial upgrade of commercial vehicle telematics.
In 2022, China's commercial vehicle telematics industry cont...
Passenger Car Intelligent Steering Industry Research Report, 2022
Research on intelligent steering of passenger cars: The development of intelligent steering is accelerating, and it will be put on vehicles in batches in 2023
In September 2022, Geely and Hella joi...
China Charging / Battery Swapping Infrastructure Market Research Report, 2022
Research of charging / battery swapping: More than 20 OEMs layout charging business, new charging station construction accelerated
From January to September 2022, the sales volume of new energy vehic...
China L2 and L2+ Autonomous Passenger Car Research Report, 2022
L2 and L2+ research: The installation rate of L2 and L2+ is expected to exceed 50% in 2025.So far, L2 ADAS has achieved mass production, and L2+ ADAS has seen development opportunities as the layout f...
Global and China L4 Autonomous Driving and Start-ups Report, 2022
L4 autonomous driving research: the industry enters a new development phase, "dimension reduction + cost reduction".
L3/L4 autonomous driving enjoys much greater policy support.
...
Software-defined vehicle Research Report 2022- Architecture Trends and Industry Panorama
Software-defined vehicle research: 40 arenas, hundreds of suppliers, and rapidly-improved software autonomyThe overall architecture of software-defined vehicles can be divided into four layers: (1) Th...
Emerging Automaker Strategy Research Report, 2022 - Li Auto
Research on Emerging Automaker Strategy: the strategic layout of Li Auto in electric vehicles, cockpits and autonomous driving
Li Auto will shift from the single extended-range route to the “extended...
Commercial Vehicle Intelligent Chassis Industry Report, 2022
Commercial vehicle industry is characterized by large output value, long industry chain, high relevance, high technical requirements, wide employment and large consumer pull, and is a barometer of nat...
China TSP and Ecological Construction Research Report, 2022
TSP research: the coverage of TSPs has spread from IVI, cockpits to vehicles.
With the emergence of Internet of Vehicles, telematics service providers (TSPs) take on the roles of operation platforms,...
Global and China Automotive Seating Industry Report, 2022
Automotive seating research: automotive seating enjoys an amazing boom in the context of autonomous driving.
As autonomous driving develops, vehicles, a simple mobility tool, are tending to be positi...
Automotive Smart Surface Industry Research Report, 2022
Smart Surface Research: As an important medium for multimodal interaction, smart surfaces lead the trend of smart cockpits.Smart surfaces represent the development trend of automotive interiors and ex...
China Passenger Car Cockpit Multi and Dual Display Research Report, 2022
Cockpit multi and dual display research: 51.5% year-on-year growth in center console multi and dual display installation from January to July 2022
ResearchInChina released "China Passenger Car Cockpi...
China Automotive Cybersecurity Hardware Research Report, 2022
Cybersecurity hardware research: security chip and HSM that meet the national encryption standards will build the automotive cybersecurity hardware foundation for China.
1. OEMs generally adopt the s...
China Automotive Cybersecurity Software Research Report, 2022
Chinese in-vehicle terminal PKI market will be worth RMB1.89 billion in 2025.
The working principle of PKI (Public Key Infrastructure) is: the infrastructure that provides security services establish...
Global and China HD Map Industry Report, 2022
HD maps have been applied on a large scale, spreading from freeways to cities
According to ResearchInChina, more than 100,000 Chinese passenger cars were equipped with HD maps by OEMs in the first ha...