China Aluminum Rolling Industry Report, 2012-2015
-
Feb/2013
- Hard Copy
- USD
$1,900
-
- Pages:81
- Single User License
(PDF Unprintable)
- USD
$1,800
-
- Code:
WEW040
- Enterprise-wide License
(PDF Printable & Editable)
- USD
$2,800
-
- Hard Copy + Single User License
- USD
$2,100
-
In 2011-2012, the investment in China aluminum rolling industry experienced the fastest growth. The investment concentrated in high precision aluminum sheets and strips, tank aluminum sheet, electronic foils, packaging foils and so forth. With the gradual realization of the above-mentioned investment projects, the proportion of high value-added products in the industry will rise significantly in the next few years.
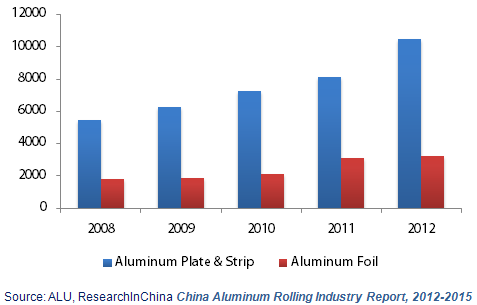
In 2012, China's capacity of aluminum sheets and strips exceeded 10 million tons for the first time, and the annual output reached 7.8 million tons, with the capacity utilization rate of about 74.5%. The aluminum foil capacity hit 3.22 million tons/a, and the annual output amounted to 2.51 million tons, with the capacity utilization rate of roughly 78%.
Capacity of Aluminum Sheets, Strips and Foils in China, 2008-2012 (Unit: kt)
?
The report mainly analyzes the output, consumption, import and export volume of aluminum sheets, strips and foils in China, as well as upstream and downstream sectors. In addition, it highlights financial performance, product mix, investment and planning of 17 major players in the industry.
CHINALCO is the world's largest comprehensive aluminum processing enterprise. As of the end of 2012, its capacity of aluminum sheets, strips and foils had hit more than 1.5 million tons, which were operated by its seven subsidiaries. In 2012, due to the decreasing aluminum price worldwide and the rising aluminum price in China, the company suffered huge losses. However, the aluminum price is expected strongly to decline, so the losses will shrink in 2013, but the loss rate will still be high.
Nanshan Aluminium is one of major aluminum profile producers in China. In recent years, the company has increased investment in aluminum plates and strips. Now, cold-rolled aluminum products have become the company's third-largest business. In 2011, cold-rolled aluminum products generated the revenue of RMB5.173 billion. In 2012, the 400,000-ton aluminum cold rolled products project (mainly can materials) of the company was put into production; when the project is completely placed into production in 2014, the company’s capacity of cold-rolled aluminum products will reach 600,000 tons/a.
Dongyangguang Aluminum is one of major aluminum foil processing enterprises in China. It shows superiority in the fields of air-conditioning aluminum foils, electrode foils, electronic foils and other products. In recent years, the company has invested vigorously in the expansion of electrode capacity. In 2012, the company’s etched foil capacity reached 27 million square meters, and the formed foil capacity equaled to about 38 million square meters. In 2013, with the completion of the projects under construction, the capacity of etched foils and formed foils will increase to 55 million square meters and 50 million square meters respectively.
1. Overview of Aluminum Rolling Industry
1.1 Definition
1.2 Industry Chain
2. Development of China Aluminum Smelting Industry
2.1 Supply & Demand
2.2 Market Price Trend
3. Development of China Aluminum Rolling Industry
3.1 Policy Environment
3.2 Industrial Characteristics
3.2.1 Profit Model
3.2.2 Entry Barrier
3.2.3 Technique and Equipment Level
3.3 Supply
3.3.1 Aluminum Plate & Strip
3.3.2 Aluminum Foil
3.4 Import & Export
3.4.1 Aluminum Plate & Strip
3.4.2 Aluminum Foil
3.5 Demand
3.5.1 Consumption
3.5.2 Consumption Pattern
4. Applications of Aluminum Plate, Strip & Foil in China
4.1 Applications of Aluminum Plate & Strip
4.1.1 Architecture
4.1.2 Packaging
4.1.3 Transportation
4.1.4 Printing
4.2 Applications of Aluminum Foil
4.2.1 Heat Transfer
4.2.2 Packaging
4.2.3 Power Electronics
5. Key Aluminum Rolling Companies in China
5.1 Aluminum Corporation of China Limited (CHALCO)
5.1.1 Profile
5.1.2 Major Equipments
5.1.3 Operation
5.1.4 Business Performance Prediction
5.2 Southwest Aluminum (Group) Co., Ltd.
5.2.1 Profile
5.2.2 Operation
5.3 Henan Mingtai Al. Industrial Co., Ltd
5.3.1 Profile
5.3.2 Operation
5.3.3 Revenue Structure
5.3.4 Gross Margin
5.3.5 Business Performance Prediction
5.4 Asia Aluminum Group
5.4.1 Profile
5.4.2 Major Equipments
5.5 Zhejiang Dongliang New Material Co., Ltd.
5.5.1 Profile
5.5.2 Operation
5.5.3 Revenue Structure
5.5.4 Gross Margin
5.5.5 Business Performance Prediction
5.6 Shandong Nanshan Aluminum Co., Ltd.
5.6.1 Capacity of Shandong Nanshan Aluminium Co., Ltd. 2012
5.6.2 Operation
5.6.3 Revenue Structure
5.6.4 Gross Margin
5.6.5 Business Performance Prediction
5.7 Yunnan Aluminum Co., Ltd.
5.7.1 Profile
5.7.2 Operation
5.7.3 Revenue Structure
5.7.4 Gross Margin
5.7.5 Business Performance Prediction
5.8 China Zhongwang Holdings Limited
5.8.1 Profile
5.8.2 Operation
5.8.3 Revenue Structure
5.8.4 Aluminum Rolling Projects 2014-2018
5.9 Guangdong Dongyangguang Aluminum Co., Ltd
5.9.1 Profile
5.9.2 Operation
5.9.3 Revenue Structure
5.9.4 Gross Margin
5.9.5 Business Performance Prediction
5.10 Zhenjiang Dingsheng Aluminum Stock Co., Ltd.
5.11 Xiashun Holdings Limited
5.12 Jiangsu Alcha Aluminum Co., Ltd.
5.12.1 Profile
5.12.2 Major Equipments
5.12.3 Operation
5.12.4 Revenue Structure
5.12.5 Gross Margin
5.12.6 Business Performance Prediction
5.13 Shandong Loften Aluminium Foil Co.,Ltd.
5.13.1 Profile
5.13.2 Major Equipments
5.13.3 Operation
5.13.4 Revenue Structure
5.13.5 Business Performance Prediction
5.14 Xinjiang Joinworld Co., Ltd.
5.14.1 Profile
5.14.2 Operation
5.14.3 Revenue Structure
5.14.4 Gross Margin
5.14.5 Business Performance Prediction
5.15 Jiangsu United Technology Co., Ltd.
5.15.1 Profile
5.15.2 Operation
5.16 Nantong South Light Electronic Material Co.,Ltd.
5.16.1 Profile
5.16.2 Operation
5.17 Guangxi Hezhou Guidong Electronic Technology Co., Ltd.
5.17.1 Profile
5.17.2 Operation
5.17.3 Development Prospect
Model Products of Aluminum Rolling Industry
Aluminum Rolling Industry Chain
Output & YoY Growth Rate of Electrolytic Aluminum in China, 2008-2012
Apparent Consumption & YoY Growth Rate of Electrolytic Aluminum in China, 2008-2012
Spot Market Price of LME Aluminum, 2008-2013
Spot Market Price of SHFE Aluminum in China, 2008-2013
Major Industrial Policies on China Aluminum Rolling Industry
(1+1) Type Hot Roughing-Finishing Rolling Production Lines Built and under Construction in China, 2012
(1+3) Type Hot Continuous Rolling Production Lines Built in China, 2012
(1+4) Type Hot Continuous Rolling Production Lines Built in China, 2012
Aluminum Plate & Strip Capacity in China, 2008-2015E
Aluminum Plate & Strip Output in China, 2008-2012
Major Aluminum Sheet & Strip Cold Rolling Investment Projects(Capacity over 100,000 tons) in China, 2012
Capacity of Aluminum Foil in China, 2008-2012
Output of Aluminum Foil in China, 2008-2012
Export Volume of Aluminum Plate & Strip in China, 2008-2012
Import Volume of Aluminum Plate & Strip in China, 2008-2012
Export Volume of Aluminum Foil in China, 2008-2012
Import Volume of Aluminum Foil in China, 2008-2012
Aluminum Plate & Strip Apparent Consumption in China, 2008-2012
Aluminum Foil Apparent Consumption in China, 2008-2012
Consumption Pattern of Aluminum Plate & Strip in China, 2010
Consumption Pattern of Aluminum Foil in China, 2010
Aluminum Plate & Strip Demand in China Building Industry, 2008-2015E
Aluminum Plate & Strip Demand in China Packaging Industry, 2008-2015E
Aluminum Plate & Strip Demand in China Transportation Industry, 2008-2015E
Aluminum Plate & Strip Demand in China Printing Industry, 2008-2015E
Aluminum Foil Demand in China Air-conditioner Industry, 2008-2015E
Aluminum Foil Demand in China Packaging Industry, 2008-2015E
Aluminum Foil Demand in China Power Electronics Industry, 2008-2015E
Main Aluminum Fabrication Subsidiary Companies of CHALCO
Revenue & Net Income of CHALCO, 2008-2012
Revenue & Gross Margin of Aluminum Fabrication Business of CHALCO, 2008-2012
Revenue and Net Income of CHALCO, 2012-2014
Revenue of Southwest Aluminum (Group), 2009-2015E
Revenue & Net Income of Henan Mingtai Al. Industrial Co., Ltd, 2008-2012
Revenue of Henan Mingtai Al. Industrial Co., Ltd by Product, 2010-2012
Revenue of Henan Mingtai Al. Industrial Co., Ltd by Region, 2010-2012
Gross Margin of Henan Mingtai Al. Industrial Co., Ltd by Product, 2010-2012
Revenue and Net Income of Henan Mingtai Al. Industrial Co., Ltd, 2012-2014E
Revenue & Net Income of Zhejiang Dongliang New Material Co., Ltd., 2008-2012
Revenue of Zhejiang Dongliang New Material Co., Ltd by Product, 2010-2012
Revenue of Zhejiang Dongliang New Material Co., Ltd by Region, 2010-2012
Gross Margin of Zhejiang Dongliang New Material Co., Ltd by Product, 2010-2012
Revenue and Net Income of Zhejiang Dongliang New Material Co., Ltd, 2012-2014E
Capacity of Shandong Nanshan Aluminium Co., Ltd. 2012
Revenue & Net Income of Shandong Nanshan Aluminium Co., Ltd., 2008-2012
Revenue of Shandong Nanshan Aluminum Co., Ltd by Product, 2011-2012
Revenue of Shandong Nanshan Aluminium Co., Ltd. by Region, 2010-2012
Gross Margin of Shandong Nanshan Aluminium Co., Ltd. by Product, 2011-2012
Main Projects of Shandong Nanshan Aluminium Co., Ltd., 2012-2015E
Revenue and Net Income of Shandong Nanshan Aluminium Co., Ltd., 2012-2014E
Capacity of Aluminum Products of Yunnan Aluminum Co. Ltd., 2012
Revenue & Net Income of Yunnan Aluminum Co. Ltd., 2008-2012
Revenue of Yunnan Aluminum Co., Ltd by Product, 2010-2012
Revenue of Yunnan Aluminum Co., Ltd by Region, 2010-2012
Gross Margin of Yunnan Aluminum Co., Ltd by Product, 2010-2012
Ongoing Investment Projects of Yunnan Aluminum Co., Ltd., 2012
Revenue and Net Income of Yunnan Aluminum Co., Ltd, 2012-2014E
Revenue & Net Income of China Zhongwang Holdings Limited, 2008-2012
Sales Volume and ASP of Main Products of China Zhongwang Holdings Limited, 2010-2012
Revenue of China Zhongwang Holdings Limited by Product, 2010-2012
Revenue of China Zhongwang Holdings Limited by Region, 2010-2012
Industry Chain of Dongyangguang Aluminum
Revenue and Net Income of Guangdong Dongyangguang Aluminum Co., Ltd, 2008-2012
Revenue of Guangdong Dongyangguang Aluminum Co., Ltd by Product, 2010-2012
Revenue of Guangdong Dongyangguang Aluminum Co., Ltd by Region, 2010-2012
Gross Margin of Guangdong Dongyangguang Aluminum Co., Ltd by Product, 2010-2012
Revenue and Net Income of Guangdong Dongyangguang Aluminum Co., Ltd, 2012-2014E
Capacities of Major Production Subsidiaries of Zhenjiang Dingsheng Aluminum Stock Co., Ltd, 2012
Performance Indicators of Thin Aluminum Foil Products of Xiashun Holdings Limited
Performance Indicators of Aluminum Sheet & Strip of Xiashun Holdings Limited
Revenue & Net Income of Jiangsu Alcha Aluminum, 2008-2012
Revenue of Jiangsu Alcha Aluminum by Product, 2010-2012
Revenue of Jiangsu Alcha Aluminum by Region, 2010-2012
Gross Margin of Jiangsu Alcha Aluminum by Product, 2010-2012
Revenue and Net Income of Jiangsu Alcha Aluminum, 2012-2014E
Revenue & Net Income of Shandong LOFTEN Aluminum Foil Co., Ltd., 2008-2012
Revenue of Shandong LOFTEN Aluminum Foil Co., Ltd by Product, 2010-2012
Revenue of Shandong LOFTEN Aluminum Foil Co., Ltd by Region, 2010-2012
Revenue and Net Income of Shandong LOFTEN Aluminum Foil Co., Ltd, 2012-2014E
Industry Chain of Xinjiang Joinworld
Revenue and Net Income of Xinjiang Joinworld, 2008-2012
Revenue of Xinjiang Joinworld by Product, 2010-2012
Revenue of Xinjiang Joinworld by Region, 2010-2012
Gross Margin of Xinjiang Joinworld by Product, 2010-2012
Electrode Foil Capacity and Output of Xinjiang Joinworld, 2011-2012
Revenue and Net Income of Xinjiang Joinworld, 2012-2014E
Subsidiaries of United Technology
Operating Revenue of United Technology, 2008-2011
Export Value of United Technology, 2008-2011
Sales of Nantong South Light, 2008-2012
Medium- and High-voltage Aluminum Foil Output of Guangxi Hezhou Guidong Electronic Technology Co., Ltd., 2005-2011
Revenue and Gross Margin of Guangxi Hezhou Guidong Electronic Technology Co., Ltd, 2008-2012
Global and China Vanadium Industry Report, 2018-2023
Vanadium, deemed as the “vitamin” of metals, finds wide application in steel, chemicals, new materials and new energy. There is now global research and development of vanadium for applying it to more ...
Global and China Cobalt Industry Report, 2018-2023
Cobalt, an essential raw material for lithium battery, is widely used in electric vehicles as well as computer, communication and consumer electronics. 59% of cobalt was used in lithium battery global...
Global and China Nickel Industry Report, 2017-2020
Global primary nickel output in 2016 fell 1.5% to 1.934 million tons. In 2017, as China’s nickel pig iron project in Indonesia reaches design capacity gradually, nickel metal supply is expected to hit...
Global and China Cobalt Industry Report, 2017-2021
In recent years, the global refined cobalt market has been in a state of oversupply, but the inventory has been decreasing year by year. In 2016, the global refined cobalt output and consumption were ...
China Silicon Carbide Industry Report, 2016-2020
China is the largest producer and exporter of silicon carbide in the world, with the capacity reaching 2.2 million tons, sweeping more than 80% of the global total. However, excessive capacity expansi...
China Antimony Industry Report, 2016-2020
According to USGS, global antimony reserves totaled 2 million tons and antimony ore production 150,000 tons in 2015. In China, the reserves of antimony stood at 950,000 tons and antimony ore productio...
Global and China Cobalt Industry Report, 2016-2020
Cobalt is an important strategic metal used in lithium battery manufacturing, hard alloy smelting and superalloy production, mainly available in Congo, Australia, Cuba and other countries.
In 2015, t...
China Silicon Carbide Industry Report, 2015-2019
China is the largest producer and exporter of silicon carbide in the world, with the capacity reaching 2.2 million tons, accounting for more than 80% of the global total. In 2014, the total silicon ca...
Global and China Antimony Industry Report, 2015
Since 2015, China’s antimony industry has been characterized by the followings:
China sees a continued decline in the output of antimony concentrates and antimony products. Owing to weak demand from ...
Global and China Bi-Metal Band Saw Blade Industry Report, 2015-2018
Since the year 2012, due to the aftermath of the global financial crisis and the sub-prime crisis, the prosperity index of manufacturing in China has continued to decline, and the machine tool industr...
Global and China Aluminum Alloy Automotive Sheet Industry Report, 2014-2017
In recent years, driven by energy conservation and emissions reduction and improvement of fuel efficiency, auto industry has been required to develop towards an increasingly lightweight trend. A great...
China Silicon Carbide Industry Report, 2014-2017
As a major producer and exporter of silicon carbide, China contributes about 80% to the global silicon carbide capacity. In 2013, China exported 286,800 tons of silicon carbide after the abolition of ...
China Antimony Industry Report, 2014-2017
Since 2014, China’s antimony industry has been characterized by the following:
First, China holds a stable position as a major antimony producer. According to the statistics by USGS, in 2013, up...
Global and China Bi-Metal Band Saw Blade Industry Report, 2014-2017
The sales volume of bi-metal band saw blade continued to slide in China, totaling 49.45 million meters throughout the year 2013, down 2.5% year on year, largely due to international financial crisis, ...
Global and China Germanium Industry Report, 2013-2016
Germanium is a typical rare and dispersed element, associating with lignite, lead-zinc deposit and copper ore. Global proven recoverable deposits of germanium amount to 8,600 metal metric tons (MMT), ...
China Petroleum and Natural Gas Drilling and Transmission Steel Pipe Market Report, 2013-2016
Along with the sustained and stable development of China's economy as well as the accelerated industrialization, China’s demand for oil and natural gas has kept rising rapidly in recent years. In 2013...
China Aluminum Rolling Industry Report, 2013-2016
As of late 2013, the capacity of aluminum foil in China, as the world’s largest producer of aluminum sheets, strips and foils, hit 3.4 million tons/a; the capacity of aluminum cold rolling sheet/strip...
China Magnesium and Magnesium Alloy Industry Report, 2013-2016
Magnesium which is featured with low density and high strength can form high-strength alloy with aluminum, copper, zinc and other metals as an important alloying element. Currently, China is a major p...