Global and China Molybdenum Industry Report, 2012-2015
-
Apr.2013
- Hard Copy
- USD
$2,050
-
- Pages:86
- Single User License
(PDF Unprintable)
- USD
$1,950
-
- Code:
ZL001
- Enterprise-wide License
(PDF Printable & Editable)
- USD
$3,100
-
- Hard Copy + Single User License
- USD
$2,250
-
In 2012, the global economic growth was weak, the bulk commodity demand was reduced, and the prices generally declined. As a result, the molybdenum market remained in the doldrums, the prices showed a downward trend, and the annual average price was USD 12.74 per pound of molybdenum, a decrease of 17.5% from 2011. At the end of 2012, the supply of molybdenum ore decreased, the demand from steel mills increased, and the molybdenum price began to rise.
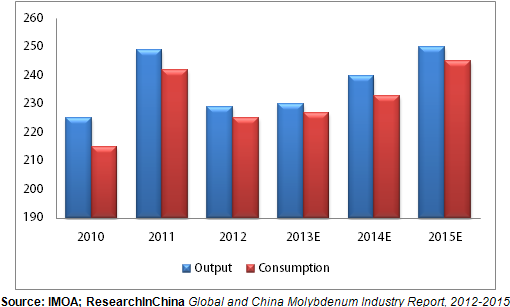
In 2012, the global molybdenum output was 229 kilotons and the consumption was 225 kilotons, basically in balance. With the recovery of steel demand since the fourth quarter of 2012, the demand for molybdenum is expected to resume growth. After 2014, some mines currently under construction will start production, such as Chile’s Sierra Gorda copper-molybdenum mine (controlled by KGHM and Sumitomo Metal) that is expected to start production in 2014. In addition, Grupo Mexico and Rio Tinto also plan to increase production.
Global Molybdenum Output and Consumption, 2010-2015 (Unit: kiloton)
China is a large producer and consumer of molybdenum in the world, and the global increment in the production and consumption of molybdenum in the past two years mainly came from China. In 2012, China produced 92 kilotons of molybdenum (equivalent to metal content), accounting for 40.2% of the global molybdenum output, and consumed 85 kilotons, accounting for 37.8% of the global molybdenum consumption. Due to the national protection on strategic resources, molybdenum resources will be concentrated in large enterprises, and the supply will be effectively controlled.
Global molybdenum producers are mainly concentrated in countries with rich molybdenum reserves such as China, the United States and Chile. Global top 10 molybdenum producers account for 2/3 of the global output. Mineral resources are controlled by major molybdenum companies, and the access to large-quantity and high-quality molybdenum ore resources has become the biggest obstacle to entering the industry.
In 2012, top 10 molybdenum producers accounted for 66.4% of the global output, and the U.S. Freeport was the largest molybdenum producer with a share of 17%, followed by Chile’s Codelo and GMexico.
Chinese molybdenum production enterprises are mainly concentrated in the regions with rich molybdenum reserves such as Henan, Shaanxi and Liaoning. Jinduicheng Molybdenum and Luoyang Molybdenum, the owners of world-class molybdenum mines Jinduicheng Molybdenum Mine and Luanchuan Molybdenum Mine respectively, are in the forefront of the world, and ranked fourth and fifth respectively in the world in terms of molybdenum output in 2012.
With six chapters and 89 charts, Global and China Molybdenum Industry Report, 2012-2015 makes an in-depth analysis of the development background, current status and market pattern of molybdenum industry in China and worldwide, and sheds light on the production, operation and development trend of global molybdenum industry leaders such as FCX and GMexico as well as Chinese enterprises including Jinduicheng Molybdenum and Luoyang Molybdenum.
1. Molybdenum Industry Overview
1.1 Basic Properties of Molybdenum
1.2 Classification of Molybdenum Products
1.3 Industry Chain
1.4 Application
2. Development of Global Molybdenum Industry
2.1 Global Molybdenum Reserves and Distribution
2.2 Exploitation
2.3 Supply
2.3.1 Supply Structure
2.3.2 Major Molybdenum Producers
2.4 Demand
2.5 Competition Pattern of Corporations Worldwide
2.6 Summary and Prospect
3. Development of China Molybdenum Industry
3.1 Policy Adjustment
3.1.1 Entry Policy
3.1.2 Export Quota Policy
3.1.3 Export Duty Policy
3.2 Molybdenum Reserves and Distribution in China
3.3 Supply
3.4 Consumer Demand
3.5 Prices
3.5.1 Prices in China
3.6 Summary and Prospect
4. Import and Export of China Molybdenum Industry
4.1 Net Export Scale of Molybdenum Products
4.2 Import and Export of Main Molybdenum Products
4.2.1 Import and Export Structure of Molybdenum Products in China
4.2.2 Primary Molybdenum Products
4.2.3 Molybdenum Chemical Products
4.2.4 Molybdenum Metal Products
4.3 Summary
5. Key Corporations Worldwide
5.1 FCX
5.1.1 Profile
5.1.2 Molybdenum Reserves
5.1.3 Operation
5.2 Codelco
5.2.1 Profile
5.2.2 Production
5.2.3 Operation
5.3 GMexico
5.3.1 Profile
5.3.2 Operation
5.4 Thompson Creek
5.4.1 Profile
5.4.2 Molybdenum Reserves
5.4.3 Production
5.4.4 Operation
5.5 Summary
6. Key Players in China
6.1 China Molybdenum Co., Ltd
6.1.1 Profile
6.1.2 Molybdenum Reserves
6.1.3 Operation
6.2 Jinduicheng Molybdenum
6.2.1 Profile
6.2.2 Molybdenum Reserves
6.2.3 Capacity Expansion
6.2.4 Operation
6.3 Jinzhou New China Dragon Moly Co., Ltd
6.3.1 Profile
6.3.2 Capacity Expansion
6.3.3 Operation
6.3.4 Strategic Planning
6.4 Tianbao Mining Group
6.4.1 Profile
6.4.2 Operation
6.4.3 Major Events
6.5 Xiamen Tungsten Co., Ltd
6.5.1 Profile
6.5.2 Operation
6.5.3 Summy
6.6 Huludao Wonful Resources Inc.
6.6.1 Profile
6.6.2 Operation
6.7 Shunchi Tungsten & Molybdenum Products Co., Ltd
6.7.1 Profile
6.7.2 Operation
6.7.3 Key Projects
6.8 Wanxin Tungsten & Molybdenum Products Co., Ltd
6.8.1 Profile
6.8.2 Operation
6.9 Rongxin Molybdenum
6.9.1 Profile
6.9.2 Operation
6.10 Daheishan Molybdenum
6.10.1 Profile
6.10.2 Molybdenum Reserves
6.10.3 Production
6.10.4 Operation
6.11 Summary
Molybdenum Output and Consumption in China, 2005-2015E
Global Molybdenum Output and Consumption, 2010-2015E
Basic Properties of Molybdenum
Classification of Major Molybdenum Products in the World
Molybdenum Industry Chain
Global Distribution of Direct Molybdenum Consumption by Product, 2012
Types of Major Molybdenum Mines in the World
Distribution of Molybdenum Reserves (Equivalent to Metal Content) by Country, 2012
Available Years of Global Molybdenum Reserves for Mining
Global Molybdenum Output (Equivalent to Metal Content), 2005-2012
Global Molybdenum Output (Equivalent to Metal Content) by Country/Region, 2008-2012
Global Byproduct Molybdenum Output (Equivalent to Metal Content) and Its Proportion in Total Molybdenum Output, 2005-2015E
Molybdenum Output of Major Molybdenum Producers in the World, 2007-2012
Global Molybdenum Projects under Construction, 2012
Global Molybdenum Consumption, 2005-2012
Global Consumer Demand for Molybdenum (by Country/Region), 2012
Market Share of Molybdenum Producers Worldwide, 2012
Global Molybdenum Output and Consumption, 2010-2015E
Entry Policies for China Molybdenum Industry, 2006-2012
Export Quota of Chinese Molybdenum Products, 2008-2012
Primary Molybdenum Products Enterprises with Export Quota in China, 2012
Molybdenum Chemical Products Enterprises with Export Quota in China, 2012
Molybdenum Metal Products Enterprises with Export Quota in China, 2012
Distribution of Molybdenum Reserves in China, 2012
Main Molybdenum Reserves in China, 2012
Molybdenum Output of China (Equivalent to Metal Content), 2005-2012
Distribution of Molybdenum Concentrate Output in China, 2012
Molybdenum Consumption (Equivalent to Metal Content) in China, 2005-2012
Market Prices of Molybdenum Iron in Europe, 2003-2012
Market Prices of Molybdenum Concentrate in China, 2004-2012
Market Prices of Molybdenum Iron in China, 2011-2013Q1
Molybdenum Output and Market Share of Key Producers in China, 2008-2012
Molybdenum Output and Consumption in China, 2005-2015E
Molybdenum Net Export Volume (Equivalent to Metal Content) in China, 2003-2012
Import Structure of Molybdenum Products (by Product) in China, 2006-2012
Export Structure of Molybdenum Products (by Product) in China, 2006-2012
Import & Export Volume of Primary Molybdenum Products in China, 2006-2012
Import & Export Volume of Molybdenum Chemical Products in China, 2006-2012
Import & Export Volume of Molybdenum Metal Products in China, 2006-2012
Import Volume of Molybdenum Products in China, 2006-2012
Export Volume of Molybdenum Products in China, 2006-2012
Organizational Chart of FCX
Products of Climax Molybdenum
Preliminary Recoverable Proven and Probable Reserves of FCX, December 31, 2012
Molybdenum Output and Sales of FCX, 2010-2015E
Operating Revenue and Net Income of FCX Molybdenum Business, 2010-2015
Molybdenum Sales of Codelco, 2009-2015E
Molybdenum Sales Breakdown of Codelco by Region, Q1-Q3 2012
Mining Products Output of AMC, 2010-2012
Sales and Net Income of AMC, 2010-2015E
Sales Breakdown of AMC, 2012
Molybdenum Reserves of Thompson Creek
Molybdenum Output of Thompson Creek, 2008-2015E
Operating Revenue and Net Income of Thompson Creek, 2008-2012
Molybdenum Output of Famous Molybdenum Manufacturers, 2010-2012
Main Molybdenum Products of China Molybdenum Co., Ltd.
Molybdenum Reserves of China Molybdenum
Operating Revenue and Net Income of China Molybdenum, 2009-2015E
Operating Revenue of China Molybdenum Co., Ltd (by Product), 2009-2012
Export Quotas and Market Share of China Molybdenum, 2011-2012
Main Products of Jinduicheng Molybdenum
Metal Molybdenum Reserves of Jinduicheng Molybdenum, 2012
Operating Revenue and Net Income of Jinduicheng Molybdenum, 2008-2015
Operating Revenue of Jinduicheng Molybdenum (by Product), 2009-2012
Molybdenum Products Capacity of Major Subsidiaries of New China Dragon Moly Co., Ltd.
Main Molybdenum Products of New China Dragon Moly Co., Ltd.
Molybdenum Products Capacity of New China Dragon Moly Co., Ltd., 2009-2012
Molybdenum Products Output of New China Dragon Moly Co., Ltd., 2010-2012
Operating Revenue and Net Income of New China Dragon Moly, 2009-2015E
Operating Revenue of New China Dragon Moly by product, 2009-2012
Gross Margin of New China Dragon Moly by Business, 2008-2012
Molybdenum Metal Reserves of Tianbao Mining Group
Operating Revenue and Net Income of Tianbao Mining Group, 2007-2009
Operating Revenue Structure of Tianbao Mining Group (by Product), H1 2009
Major Molybdenum Enterprises of Tianbao Mining Group
Operating Revenue and Net Income of Xiamen Tungsten Co., Ltd, 2009-2015E
Operating Revenue and Net Income of Molybdenum Subsidiary of Xiamen Tungsten Co., Ltd, 2012
Export Quota of Primary Molybdenum Products of Wonful, 2008-2012
Prime Operating Revenue and Total Profit of Wonful, 2007-2009
Main Molybdenum Products of Shunchi Tungsten & Molybdenum Products Co., Ltd
Export Quota of Shunchi Tungsten & Molybdenum Products Co., Ltd., 2009-2012
Prime Operating Revenue and Total Profit of Shunchi Tungsten & Molybdenum Products Co., Ltd., 2004-2008
Export Quota of WanXin Tungsten & Molybdenum Products Co., Ltd., 2008-2012
Prime Operating Revenue and Total Profit of WanXin Tungsten & Molybdenum Products Co., Ltd., 2004-2009
Branches of Rongxin Molybdenum
Prime Operating Revenue and Total Profit of Rongxin Molybdenum, 2004-2008
Major Capacity Expansion Projects of Daheishan Molybdenum, 2007-2009
Output and Sales of Molybdenum concentrate of Daheishan Molybdenum, 2008-2011
Operating Revenue and Net Income of Daheishan Molybdenum, 2007-2011
Operating Revenue, Net Income and Business of Molybdenum Manufacturers in China, 2012
Global and China Vanadium Industry Report, 2018-2023
Vanadium, deemed as the “vitamin” of metals, finds wide application in steel, chemicals, new materials and new energy. There is now global research and development of vanadium for applying it to more ...
Global and China Cobalt Industry Report, 2018-2023
Cobalt, an essential raw material for lithium battery, is widely used in electric vehicles as well as computer, communication and consumer electronics. 59% of cobalt was used in lithium battery global...
Global and China Nickel Industry Report, 2017-2020
Global primary nickel output in 2016 fell 1.5% to 1.934 million tons. In 2017, as China’s nickel pig iron project in Indonesia reaches design capacity gradually, nickel metal supply is expected to hit...
Global and China Cobalt Industry Report, 2017-2021
In recent years, the global refined cobalt market has been in a state of oversupply, but the inventory has been decreasing year by year. In 2016, the global refined cobalt output and consumption were ...
China Silicon Carbide Industry Report, 2016-2020
China is the largest producer and exporter of silicon carbide in the world, with the capacity reaching 2.2 million tons, sweeping more than 80% of the global total. However, excessive capacity expansi...
China Antimony Industry Report, 2016-2020
According to USGS, global antimony reserves totaled 2 million tons and antimony ore production 150,000 tons in 2015. In China, the reserves of antimony stood at 950,000 tons and antimony ore productio...
Global and China Cobalt Industry Report, 2016-2020
Cobalt is an important strategic metal used in lithium battery manufacturing, hard alloy smelting and superalloy production, mainly available in Congo, Australia, Cuba and other countries.
In 2015, t...
China Silicon Carbide Industry Report, 2015-2019
China is the largest producer and exporter of silicon carbide in the world, with the capacity reaching 2.2 million tons, accounting for more than 80% of the global total. In 2014, the total silicon ca...
Global and China Antimony Industry Report, 2015
Since 2015, China’s antimony industry has been characterized by the followings:
China sees a continued decline in the output of antimony concentrates and antimony products. Owing to weak demand from ...
Global and China Bi-Metal Band Saw Blade Industry Report, 2015-2018
Since the year 2012, due to the aftermath of the global financial crisis and the sub-prime crisis, the prosperity index of manufacturing in China has continued to decline, and the machine tool industr...
Global and China Aluminum Alloy Automotive Sheet Industry Report, 2014-2017
In recent years, driven by energy conservation and emissions reduction and improvement of fuel efficiency, auto industry has been required to develop towards an increasingly lightweight trend. A great...
China Silicon Carbide Industry Report, 2014-2017
As a major producer and exporter of silicon carbide, China contributes about 80% to the global silicon carbide capacity. In 2013, China exported 286,800 tons of silicon carbide after the abolition of ...
China Antimony Industry Report, 2014-2017
Since 2014, China’s antimony industry has been characterized by the following:
First, China holds a stable position as a major antimony producer. According to the statistics by USGS, in 2013, up...
Global and China Bi-Metal Band Saw Blade Industry Report, 2014-2017
The sales volume of bi-metal band saw blade continued to slide in China, totaling 49.45 million meters throughout the year 2013, down 2.5% year on year, largely due to international financial crisis, ...
Global and China Germanium Industry Report, 2013-2016
Germanium is a typical rare and dispersed element, associating with lignite, lead-zinc deposit and copper ore. Global proven recoverable deposits of germanium amount to 8,600 metal metric tons (MMT), ...
China Petroleum and Natural Gas Drilling and Transmission Steel Pipe Market Report, 2013-2016
Along with the sustained and stable development of China's economy as well as the accelerated industrialization, China’s demand for oil and natural gas has kept rising rapidly in recent years. In 2013...
China Aluminum Rolling Industry Report, 2013-2016
As of late 2013, the capacity of aluminum foil in China, as the world’s largest producer of aluminum sheets, strips and foils, hit 3.4 million tons/a; the capacity of aluminum cold rolling sheet/strip...
China Magnesium and Magnesium Alloy Industry Report, 2013-2016
Magnesium which is featured with low density and high strength can form high-strength alloy with aluminum, copper, zinc and other metals as an important alloying element. Currently, China is a major p...