China Commercial Vehicle (Bus and Truck) Industry Report, 2017-2021
-
Aug.2017
- Hard Copy
- USD
$3,200
-
- Pages:208
- Single User License
(PDF Unprintable)
- USD
$3,000
-
- Code:
ZJF106
- Enterprise-wide License
(PDF Printable & Editable)
- USD
$4,500
-
- Hard Copy + Single User License
- USD
$3,400
-
Commercial vehicle as means of production is tied up with national economic development. As there have been limited starts of real estate and large infrastructure construction projects in China over recent years, the commercial vehicle market ushers in a period of stable development. In 2016, China produced 3.6981 million commercial vehicles with a yr-on-yr rise of 8.0%, and sold 3.6513 million units, up 5.8% from a year earlier. In H1 2017, China’s output and sales volume of commercial vehicle reported 2.043 million units and 2.1009 million units, respectively, surging by 13.8% and 17.4% year on year. The growth rates rose by 12.3 percentage points and 15.5 percentage points, respectively.?
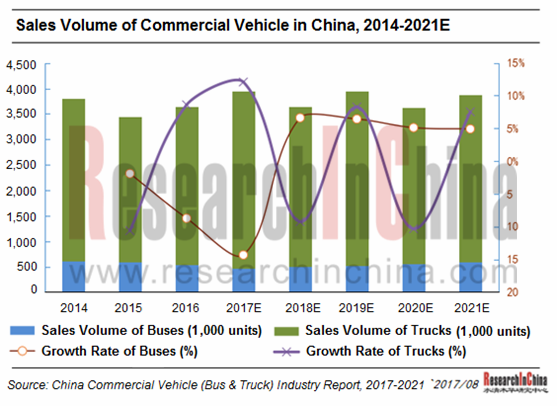
Of commercial vehicle, truck and bus markets performed differently. In 2016, truck production and sales in China grew 11.2% and 8.8% separately, and in H1 2017 truck production and sales at home surged 18.7% and 22.6% respectively. Yet, bus production and sales both showed a downward trend, dropping 7.4% and 8.7% respectively in 2016, and falling 15.3% and 14.0% separately in H1 2017.
In the upcoming years, upgrading of emission standards, policy dividend and market demand will bring vast development room for the truck market. Specifically, the center axle vehicle models that meet new national standard GB1589-2016 will be promoted further; the sales volume of 6×4 tractor shoots up thanks to nationwide management of overloads; the full implementation of national V emission standards urges logistics users to replace freight vehicle; the debut of FOTON’s and SINOTRUK’s self-driving trucks will stimulate the application of artificial intelligence and mobile internet technologies in heavy truck; and the rapid development of express delivery industry has new demand for light and medium trucks and pure electric logistics vehicle for city distribution.
Affected by subsidy reduction for new energy vehicle, the higher technical threshold as well as competition from high-speed rail and other factors, the bus market is still facing drastic fall in the future. On the other hand, the networking of city buses and the substitution of new energy vehicle still give impetus to the bus industry.
The competition pattern of commercial vehicle brands remains stable relatively in China, with high market concentration. In 2016, the top 10 bus manufacturers in China seized a combined 71.47% market share, and the top 5 bus manufacturers held? 49.58% market shares; the top 10 truck manufacturers accounted for 67.56% of total truck sales in China, and the top 5 truck manufacturers made up about 46.01% of total truck sales. In the bus market, Yutong Bus and Xiamen King Long Motor have seen robust development of product lines (light, medium, large buses) in an all-round way and steadily ranked the top list in the industry, with companies like JMC, Jinbei and Foton ranking the top five by dint of light vehicle quantities in the market. In the truck field, FOTON and Dongfeng Motor ranked the top two by sales volume due to rich product mix, and SAIC-GM-Wuling ranked the third by absolute superiority in the mini truck market.
China Commercial Vehicle (Bus & Truck) Industry Report, 2017-2021 by ResearchInChina highlights the following:
 Bus industry overview (definition, classification, development trend, industrial policy, etc.);
Overall development of China bus industry (output, sales volume, ownership, etc.);
Overview of bus market segments in China, including large bus, medium bus and light bus (output, sales volume, competitive pattern, etc.);
China new energy bus market (output, sales volume, competitive pattern, industrial policy, etc.);
Bus industry chain in China, involving raw materials market, downstream application market, etc.;
Overview of truck industry in China (product definition, classification, technology source, latest policy development orientation, etc.);
Status quo of China truck industry (ownership, output, sales volume, market structure, import & export, competitive pattern, etc.);
Overview of truck market segments in China, covering heavy truck, medium truck, light truck and mini truck (output, sales volume, competitive pattern, etc.);
Truck industry chain in China, involving raw materials market, downstream application market, etc.;
29 commercial vehicle manufacturers (like Yutong Bus, Zhongtong Bus, King Long Motor, FAW Group, Dongfeng Motor Corporation, Sinotruk, Foton, JMC, JAC), including profile, financial situation, output, sales volume, pillar products, distribution of production bases, latest news, etc.
Part I Bus Industry
1 Overview of Bus Industry
1.1 Introduction to Product
1.2 Product Classification
1.3 Policies
1.4 Bus Active Safety and Telematics
1.4.1 Policy and Planning
1.4.2 Technical Standards
1.4.3 Enterprises’ Layout
2 China Bus Market
2.1 Market Size
2.2 Market Structure
2.3 Competitive Landscape
2.3.1 Market Share
2.3.2 Performance Comparison
2.4 Market Segments
2.4.1 Coach
2.4.2 Public Bus
2.4.3 School Bus
2.5 Natural Gas Bus
3 Bus Market Segments in China
3.1 Large Bus
3.1.1 Market Size
3.1.2 Competitive Pattern
3.2 Medium Bus
3.2.1 Market Size
3.2.2 Competitive Pattern
3.3 Light Bus
3.3.1 Market Size
3.3.2 Competitive Pattern
4 New Energy Bus Market
4.1 Market Size
4.2 Competitive Pattern
4.3 Industrial Policy
4.3.1Policy on Fiscal Subsidies
4.3.2 Policy of Cutting Subsidies for Diesel Oil and Increasing Subsidies for Elecric Bus
4.3.3 Promotion and Assessment Measures
4.4 Technical Routes
4.5 Fuel Cell Bus
5 Bus Industry Chain
5.1 Upstream Raw Materials
5.2 Key Components
5.2.1 Transmission
5.2.2 Wheel Hub
5.2.3 New Energy Battery
5.3 Downstream Demand
5.3.1 Passenger Transport
5.3.2 High-Speed Rail
5.3.3 Tourism
Part II Truck Industry
6 Overview of Truck Industry
6.1 Definition and Classification
6.2 Technology Introduction
6.3 Latest Policy in 2016-2017
6.3.1 Implementation of National V Emission Standard
6.3.2 GB1589 Standard and “921 New Deal”
6.3.3 Cancellation of Low-speed Truck Category
6.3.4 Compulsory Installation of ABS onto Trucks
6.3.5 ‘Yellow Label’ Vehicle (that doesn’t meet exhaust emission standards) Continue to Be Eliminated
6.4 Self-driving and Telematics
6.4.1 Truck Self-Driving
6.4.2 Truck Telematics
7 Truck Market
7.1 Ownership
7.2 Output and Sales Volume
7.2.1 Output
7.2.2 Sales Volume
7.3 Market Structure
7.4 Import & Export
7.5 Competitive Pattern
8 Truck Market Segments
8.1 Heavy-duty Truck
8.1.1 Output and Sales Volume
8.1.2 Competitive Pattern
8.1.3 Natural Gas Heavy Truck
8.1.4 High-end Heavy Truck
8.2 Medium Truck
8.2.1 Output and Sales Volume
8.2.2 Competitive Pattern
8.3 Light Truck
8.3.1 Output and Sales Volume
8.3.2 Competitive Pattern
8.4 Mini Truck
8.4.1 Output and Sales Volume
8.4.2 Competitive Pattern
9 Truck Industry Chain
9.1 Overview of Industrial Chain
9.2 Key Components
9.2.1 Cost Structure
9.2.2 Supporting
9.3 Raw Materials Market
9.3.1 Iron & Steel
9.3.2 Rubber
9.4 Downstream Market
9.4.1 Infrastructure Construction
9.4.2 Real Estate Development
9.4.3 Highway Freight
Part III Companies
10 Companies
10.1 Zhengzhou Yutong Bus Co., Ltd.
10.1.1 Profile
10.1.2 Financial Situation
10.1.3 Revenue Structure
10.1.4 Output and Sales
10.1.5 New Energy Bus
10.1.6 Production Capacity
10.1.7 R&D Expenses
10.1.8 Cost Structure
10.1.9 Components & Parts
10.1.10 Developments
10.1.11 Operational Prospects
10.2 Xiamen King Long Motor Group
10.2.1 Profile
10.2.2 Financial Situation
10.2.3 Revenue Structure
10.2.4 Operation of Key Subsidiaries
10.2.5 Output and Sales
10.2.6 New Energy Bus
10.2.7 Production Capacity
10.2.8 R&D Expenses
10.2.9 Cost Structure
10.2.10 Developments
10.2.11 Operational Prospects
10.3 Zhongtong Bus and Holding Co., Ltd.
10.3.1 Profile
10.3.2 Financial Situation
10.3.3 Revenue Structure
10.3.4 Output and Sales
10.3.5 New Energy Bus
10.3.6 R&D Expenses
10.3.7 Cost Structure
10.3.8 Developments
10.3.9 Operational Prospects
10.4 Beiqi Foton Motor Co., Ltd.
10.4.1 Profile
10.4.2 Financial Situation
10.4.3 Revenue Structure
10.4.4 Bus Output and Sales
10.4.5 New Energy Bus
10.4.6 Truck Output and Sales Volume
10.4.7 Production Capacity
10.4.8 R&D Expenses
10.4.9 Progress in Launch of New Products
10.4.10 Operational Prospects
10.5 Anhui Ankai Automobile Co., Ltd.
10.5.1 Profile
10.5.2 Financial Situation
10.5.3 Revenue Structure
10.5.4 Output and Sales
10.5.5 New Energy Bus
10.5.6 Production Capacity
10.5.7 R&D Expenses
10.5.8 Cost Structure
10.6 Liaoning SG Automotive Group Co., Ltd.
10.6.1 Profile
10.6.2 Financial Situation
10.6.3 Revenue Structure
10.6.4 Output and Sales
10.6.5 New Energy Business
10.6.6 Cost Structure
10.7 Yangzhou Asiastar Bus Co., Ltd.
10.7.1 Profile
10.7.2 Financial Situation
10.7.3 Revenue Structure
10.7.4 Output and Sales
10.7.5 New Energy Bus
10.7.6 R&D Expenses
10.7.7 Cost Structure
10.8 BYD
10.8.1 Profile
10.8.2 Financial Situation
10.8.3 Revenue Structure
10.8.4 Output and Sales
10.8.5 New Energy Bus
10.8.6 Developments
10.9 Anhui Jianghuai Automobile Group Corp., Ltd. (JAC)
10.9.1 Profile
10.9.2 Financial Situation
10.9.3 Revenue Structure
10.9.4 Output and Sales
10.9.5 Capacity Distribution
10.9.6 R&D Expenses
10.9.7 Cost Structure
10.9.8 Developments
10.9.9 Operational Prospects
10.10 Shenyang Jinbei Automotive Co., Ltd.
10.10.1 Profile
10.10.2 Financial Situation
10.10.3 Revenue Structure
10.10.4 Output and Sales
10.10.5 R&D Expenses
10.10.6 Cost Structure
10.10.7 Operational Prospects
10.11 Jiangling Motors Co., Ltd.(JMC)
10.11.1 Profile
10.11.2 Financial Situation
10.11.3 Revenue Structure
10.11.4 Output and Sales
10.11.5 Capacity Distribution
10.11.6 R&D Expenses
10.11.7 Developments
10.11.8 Operational Prospects
10.12 Dongfeng Motor Corporation
10.12.1 Profile
10.12.2 Financial Situation
10.12.3 Revenue Structure
10.12.4 Output and Sales
10.12.5 R&D Expenses
10.12.6 Cost Structure
10.12.7 Operational Prospects
10.12.8 Developments
10.13 Nanjing IVECO Automobile Co., Ltd.(NAVECO)
10.13.1 Profile
10.13.2 Output and Sales
10.13.3 Developments
10.14 Hebei Baoding Changan Bus Co., Ltd.
10.14.1 Profile
10.14.2 Output and Sales
10.14.3 Developments
10.15 SAIC MAXUS Automotive Co., Ltd.
10.15.1 Profile
10.15.2 Output and Sales
10.15.3 New Energy Business
10.15.4 Developments
10.16 Fujian New Forta Automobile Industry Co., Ltd.
10.16.1 Profile
10.16.2 Output and Sales
10.17 FAW Jiefang Automotive Co., Ltd.
10.17.1 Profile
10.17.2 Output and Sales
10.17.3 Launch of New Products
10.17.4 Production Base
10.17.5 Developments
10.18 China National Heavy Duty Truck Group Co., Ltd. (SINOTRUK)
10.18.1 Profile
10.18.2 Operation
10.18.3 Output and Sales
10.18.4 Heavy Truck Business
10.19 Shaanxi Automobile Group Co., Ltd.
10.19.1 Profile
10.19.2 Main Products
10.19.3 Heavy Truck Business
10.19.4 Developments
10.20 Hualing Xingma Automobile (Group) Co., Ltd.
10.20.1 Profile
10.20.2 Operation
10.20.3 Truck Business
10.20.4 Output and Sales
10.21 QingLing Motors (Group) Co., Ltd.
10.21.1 Profile
10.21.2 Operation
10.21.3 Truck Business
10.22 SAIC GM Wuling (SGMW)
10.22.1 Profile
10.22.2 Main Business
10.22.3 Output and Sales
10.22.4 Production Base
10.23 SAIC-IVECO Hongyan
10.23.1 Profile
10.23.2 Heavy Truck Business
10.23.3 Sales Goal for 2017
10.24 Hubei Tri-Ring Special Vehicle Co., Ltd.
10.24.1 Profile
10.24.2 Truck Business
10.24.3 Output and Sales
10.24.4 Developments
10.25 XCMG Automobile Co., Ltd.
10.25.1 Profile
10.25.2 Heavy Truck Business
10.25.3 Capacity Distribution
10.26 GAC HINO Motors Co., Ltd.
10.26.1 Profile
10.26.2 Operation
10.26.3 Heavy Truck Business
10.26.4 Capacity
10.27 Zhejiang Feidie Automobile Manufacturing Co., Ltd.
10.27.1 Profile
10.27.2 Truck Business
10.28 Baotou Bei Ben Heavy-Duty Truck Co., Ltd.
10.28.1 Profile
10.28.2 Heavy Truck Business
10.29 Shanxi Dayun Automobile Manufacturing Co., Ltd
10.29.1 Profile
10.29.2 Truck Business
Intelligent Operation Systems of Major Bus Enterprises in China
Output and Sales Volume of Bus in China, 2005-2021E
Bus Market Structure in China, 2005-2021E
TOP10 Bus Enterprises in China, 2014
TOP10 Bus Enterprises in China, 2015
TOP10 Bus Enterprises in China, 2016
TOP10 Bus Enterprises in China, 2017
Revenue of Major Bus Enterprises in China, 2014-2017
Net Income of Major Bus Enterprises in China, 2014-2017
Gross Margin of Major Bus Enterprises in China, 2014-2017
Sales Volume of Buses in China by Purpose, 2014-2016
Medium and Large Coach Market Structure in China by Purpose, 2016
Sales Volume of Buses in China by Type, 2014-2016
Sales Volume of School Bus in China, 2009-2016
Output and Sales Volume of Natural Gas Bus in China, 2014-2017
Output of Large Bus and Chassis in China, 2005-2021E
Sales Volume of Large Bus and Chassis in China, 2005-2021E
TOP10 Large Bus Enterprises in China, 2014
Market Share of Large Bus Chassis Enterprises in China, 2014
TOP10 Large Bus Enterprises in China, 2015
Market Share of Large Bus Chassis Enterprises in China, 2015
TOP10 Large Bus Enterprises in China, 2016
Market Share of Large Bus Chassis Enterprises in China, 2016
TOP10 Large Bus Enterprises in China, 2017
Market Share of Large Bus Chassis Enterprises in China, 2017
Output of Medium Bus and Chassis in China, 2005-2021E
Sales Volume of Medium Bus and Chassis in China, 2005-2021E
TOP10 Medium Bus Enterprises in China, 2014
Market Share of Medium Bus Chassis Enterprises in China, 2014
TOP10 Medium Bus Enterprises in China, 2015
Market Share of Medium Bus Chassis Enterprises in China, 2015
TOP10 Medium Bus Enterprises in China, 2016
Market Share of Medium Bus Chassis Enterprises in China, 2016
TOP10 Medium Bus Enterprises in China, 2017
Market Share of Medium Bus Chassis Enterprises in China, 2017
Output of Light Bus and Chassis in China, 2005-2021E
Sales Volume of Light Bus and Chassis in China, 2005-2021E
TOP10 Light Bus Enterprises in China, 2014
Market Share of Light Bus Chassis Enterprises in China, 2014
TOP10 Light Bus Enterprises in China, 2015
Market Share of Light Bus Chassis Enterprises in China, 2015
TOP10 Light Bus Enterprises in China, 2016
Market Share of Light Bus Chassis Enterprises in China, 2016
TOP10 Light Bus Enterprises in China, 2017
Market Share of Light Bus Chassis Enterprises in China, 2017
Output of New Energy Bus in China, 2016-2017
Output of TOP20 New Energy Bus Enterprises in China, 2016-2017
Output of TOP20 Battery Electric Bus Enterprises in China, 2016-2017
Output of TOP20 Plug-in Hybrid Bus Enterprises in China, 2016-2017
Subsidy Standards for Electric Bus, 2017
Comparison of Raw Material Costs between Major Bus Enterprises in China, 2014-2016
Market Share of Major Commercial Vehicle Transmission Enterprises in China
Major Commercial Vehicle Transmission Suppliers in China
Wheel Suppliers of Major Bus Enterprises in China
Highway Passenger Transport in China, 2004-2017
Operating Mileage of High-speed Railways in China, 2013-2016
Total Tourism Revenue in China, 2001-2016
Number of Tourists in Golden Week in China, 2008-2017
Truck (Freight Vehicle) Segments
Applications of Truck by Sector
Technology Introduction of Major Heavy Truck Manufacturers in China
Schedules of Implementation of National V Emission Standards for Motor Vehicles in China
Identification Standards for Overrun & Overload of Road Freight Vehicles (in 6-axis case)
Policies and Regulations for Commercial Vehicle Telematics
News about Truck Telematics at Home and Abroad
Ownership of Trucks in China, 2010-2021E
Output of Trucks in China, 2010-2021E
Sales Volume of Trucks in China, 2010-2021E
Output of Trucks and YoY Growth in China by Product Segment, 2016-2017
Sales Volume of Trucks and YoY Growth in China by Product Segment, 2016-2017
Export Volume of Trucks in China, Jan.-Dec. 2016
Import Volume of Trucks in China, Jan.-Dec. 2016
Sales Volume and Market Share of TOP10 Truck Enterprises in China, 2016-2017
Output and Sales Volume of Complete Heavy Truck in China, 2010-2021E
Output and Sales Volume of Incomplete Heavy Truck in China, 2010-2021E
Output and Sales Volume of Semi-trailer Towing Vehicle in China, 2010-2021E
Sales Volume and Market Share of TOP10 Complete Heavy Truck Enterprises in China, 2016-2017
Sales Volume and Market Share of TOP10 Incomplete Heavy Truck Enterprises in China, 2016-2017
Output and Sales Volume of TOP10 Semi-trailer Towing Vehicle Enterprises in China, 2016-2017
Sales Volume of Natural Gas Heavy Truck in China, 2014-2021E
Major Natural Gas Heavy Truck Enterprises in China
High-end Heavy Truck Products of Enterprises in China
Output and Sales Volume of Complete Medium Truck in China, 2010-2021E
Output and Sales Volume of Incomplete Medium Truck in China, 2010-2021E
Sales Volume and Market Share of TOP10 Complete Medium Truck Enterprises in China, 2016-2017
Sales Volume and Market Share of TOP10 Incomplete Medium Truck Enterprises in China, 2016-2017
Output and Sales Volume of Complete Light Truck in China, 2010-2021E
Output and Sales Volume of Incomplete Light Truck in China, 2010-2021E
Sales Volume and Market Share of TOP10 Complete Light Truck Enterprises in China, 2016-2017
Sales Volume and Market Share of TOP10 Incomplete Light Truck Enterprises in China, 2016-2017
Output and Sales Volume of Complete Mini Truck in China, 2010-2021E
Output and Sales Volume of Incomplete Mini Truck in China, 2010-2021E
Sales Volume and Market Share of TOP10 Complete Mini Truck Enterprises in China, 2016-2017
Vehicle Industry Chain
Cost Structure of Truck Industry
Transmission Supply Relationship of Major Heavy Truck Enterprises in China
Output and Sales Volume of Galvanized Sheet (Strip) in China 2010-2017
Price of Galvanized Coil in China (Shanghai), 2014-2017
Output and Sales Volume of Cold Rolled Sheet in China, 2010-2017
Price of Cold Rolled Coil in China (Shanghai, Tianjin, Guangzhou), 2016-2017
Price of Natural Rubber Futures in China, 2012-2017
Completed Investment in Fixed Assets in China, 2010-2017
Completed Investment in Real Estate Development in China, 2010-2017
New Housing Starts and Sales Area in China, 2005-2017
Highway Freight Volume and Turnover in China, 2005-2017
Main Financial Indices of Zhengzhou Yutong Bus, 2012-2017
Operating Revenue Structure of Zhengzhou Yutong Bus by Business, 2013-2016
Operating Revenue Structure of Zhengzhou Yutong Bus by Region, 2013-2016
Output and Sales Volume of Zhengzhou Yutong Bus by Product, 2012-2017
Sales Structure of Zhengzhou Yutong Bus, 2015-2016
Output of New Energy Bus of Zhengzhou Yutong Bus, 2014-2017
Sales Volume of New Energy Bus of Zhengzhou Yutong Bus, 2012-2016
Sales Volume of New Energy Bus of Zhengzhou Yutong Bus by Type, 2015-2016
R&D Costs of Zhengzhou Yutong Bus, 2009-2016
Production Cost Structure of Zhengzhou Yutong Bus, 2014-2016
Revenue, Net Income and Gross Margin of Zhengzhou Yutong Bus, 2015-2021E
Main Financial Indices of Xiamen King Long Motor Group, 2012-2017
Revenue and Gross Margin of Xiamen King Long Motor Group by Product, 2015-2016
Operating Revenue Structure of Xiamen King Long Motor Group by Region, 2013-2016
Revenue and Net Income of Main Subsidiaries of Xiamen King Long Motor Group, 2014-2016
Bus Output of Xiamen King Long Motor Group’s Subsidiaries, 2012-2017
Bus Sales Volume of Xiamen King Long Motor Group’s Subsidiaries, 2012-2017
Truck Output and Sales Volume of Xiamen King Long Motor Group, 2012-2017
Sales Volume of New Energy Bus of Xiamen King Long Motor Group by Length, 2015-2016
Sales Volume of New Energy Bus of Xiamen King Long Motor Group by Purpose, 2015-2016
Purchased Core Parts as a Percentage of Total Core Parts for New Energy Bus of Xiamen King Long Motor Group
R&D Costs of Xiamen King Long Motor Group, 2010-2016
Production Cost Structure of Xiamen King Long Motor Group, 2013-2016
Revenue, Net Income and Gross Margin of Xiamen King Long Motor Group, 2015-2021E
Main Financial Indices of Zhongtong Bus and Holding, 2012-2017
Operating Revenue Structure of Zhongtong Bus and Holding by Business, 2013-2016
Operating Revenue Structure of Zhongtong Bus and Holding by Region, 2013-2016
Output and Sales Volume of Zhongtong Bus and Holding, 2012-2017
Output of New Energy Bus of Zhongtong Bus and Holding, 2014-2017
R&D Costs of Zhongtong Bus and Holding, 2012-2016
Production Cost Structure of Zhongtong Bus and Holding, 2013-2016
Revenue, Net Income and Gross Margin of Zhongtong Bus and Holding, 2015-2021E
Main Financial Indices of Beiqi Foton Motor, 2010-2017
Operating Revenue Structure of Beiqi Foton Motor by Business, 2014-2016
Operating Revenue Structure of Beiqi Foton Motor by Region, 2013-2016
Output and Sales Volume of Buses of Beiqi Foton Motor by Type, 2012-2017
Output of New Energy Bus of Beiqi Foton Motor, 2014-2017
Sales Volume of AUV New Energy Bus of Beiqi Foton Motor, 2013-2016
Output and Sales of Heavy Truck of BAIC Group (Beiqi Foton Motor), 2010-2017
Output and Sales of Medium Truck of BAIC Group (Beiqi Foton Motor), 2010-2017
Output and Sales of Light Truck of BAIC Group, 2010-2017
Output and Sales of Mini Truck of BAIC Group, 2010-2017
Capacity of Beijing Foton Daimler Automotive, 2016
R&D Costs of Beiqi Foton Motor, 2010-2016
Revenue, Net Income and Gross Margin of Beiqi Foton Motor, 2015-2021E
Financial Indices of Anhui Ankai Automobile, 2012-2017
Operating Revenue Structure of Anhui Ankai Automobile by Business, 2015-2016
Operating Revenue Structure of Anhui Ankai Automobile by Region, 2013-2016
Output and Sales Volume of Anhui Ankai Automobile, 2012-2017
Output of New Energy Bus of Anhui Ankai Automobile, 2014-2017
R&D Costs of Anhui Ankai Automobile, 2010-2016
Production Cost Structure of Anhui Ankai Automobile, 2015-2016
Financial Indices of Liaoning SG Automotive Group, 2012-2017
Operating Revenue Structure of Liaoning SG Automotive Group by Business, 2013-2016
Operating Revenue Structure of Liaoning SG Automotive Group by Region, 2013-2016
Output and Sales Volume of Bus of Liaoning SG Automotive Group (Dandong Huanghai Automotive), 2012-2017
Output of Huanghai New Energy Bus of Liaoning SG Automotive Group, 2014-2017
Production Cost Structure of Liaoning SG Automotive Group, 2014-2016
Financial Indices of Yangzhou Asiastar Bus, 2012-2017
Operating Revenue Structure of Yangzhou Asiastar Bus by Business, 2013-2016
Operating Revenue Structure of Yangzhou Asiastar Bus by Region, 2013-2016
Output and Sales Volume of Yangzhou Asiastar Bus, 2012-2017
Output and Sales Volume of New Energy Bus of Yangzhou Asiastar Bus, 2014-2016
Subsidy Revenue of New Energy Bus of Yangzhou Asiastar Bus, 2015-2016
R&D Costs of Yangzhou Asiastar Bus, 2010-2016
Production Cost Structure of Yangzhou Asiastar Bus, 2014-2016
Financial Indices of BYD, 2012-2017
Operating Revenue Structure of BYD by Business, 2013-2016
Operating Revenue Structure of BYD by Region, 2015-2016
Output and Sales Volume of Bus of BYD, 2012-2017
Main New Energy Bus Products of BYD
Capacity and Output of Main Complete Vehicle Manufacturing Bases of BYD, 2016
Keys Orders of BYD, 2016
Financial Indices of Anhui Jianghuai Automobile Group, 2012-2017
Operating Revenue Structure of Anhui Jianghuai Automobile Group by Business, 2015-2016
Operating Revenue Structure of Anhui Jianghuai Automobile Group by Region, 2013-2016
Output and Sales Volume of Bus of Anhui Jianghuai Automobile Group, 2012-2017
Output and Sales Volume of Heavy Truck of Anhui Jianghuai Automobile Group, 2010-2017
Output and Sales Volume of Medium Truck of Anhui Jianghuai Automobile Group, 2010-2017
Output and Sales Volume of Light Truck of Anhui Jianghuai Automobile Group, 2010-2017
Truck Capacity Distribution of Anhui Jianghuai Automobile Group, 2016
R&D Costs of Anhui Jianghuai Automobile Group, 2010-2016
Production Cost Structure of Anhui Jianghuai Automobile Group, 2016
Revenue, Net Income and Gross Margin of Anhui Jianghuai Automobile Group, 2014-2021E
Financial Indices of Shenyang Jinbei Automotive, 2012-2017
Operating Revenue Structure of Shenyang Jinbei Automotive by Business, 2013-2016
Operating Revenue Structure of Shenyang Jinbei Automotive by Region, 2013-2016
Output and Sales Volume of Commercial Vehicle of Shenyang Jinbei Automotive, 2012-2017
R&D Costs of Shenyang Jinbei Automotive, 2012-2016
Production Cost Structure of Shenyang Jinbei Automotive, 2014-2016
Revenue, Net Income and Gross Margin of Shenyang Jinbei Automotive, 2015-2021E
Financial Indices of Jiangling Motors, 2012-2017
Operating Revenue Structure of Jiangling Motors by Business, 2013-2016
Bus Output and Sales Volume of Jiangling Motors, 2012-2017
Output and Sales Volume of Light Truck of Jiangling Motors Group, 2010-2017
Capacity Distribution of Main Trucks of Jiangling Motors Group, 2016
R&D Costs of Jiangling Motors, 2010-2016
Revenue, Net Income and Gross Margin of Jiangling Motors, 2015-2021E
Financial Indices of Dongfeng Motor Corporation, 2012-2017
Operating Revenue Structure of Dongfeng Motor Corporation by Business, 2013-2016
Operating Revenue Structure of Dongfeng Motor Corporation by Region, 2013-2016
Output and Sales Volume of Bus of Dongfeng Motor Corporation, 2012-2017
Output and Sales Volume of Heavy Truck of Dongfeng Motor Corporation, 2010-2017
Output and Sales Volume of Medium Truck of Dongfeng Motor Corporation, 2010-2017
Output and Sales Volume of Light Truck of Dongfeng Motor Corporation, 2010-2017
Output and Sales Volume of Mini Truck of Dongfeng Motor Corporation, 2012-2017
Truck Capacity Distribution of Dongfeng Motor Group, 2016
R&D Costs of Dongfeng Motor Corporation, 2010-2016
Production Cost Structure of Dongfeng Motor Corporation, 2014-2016
Revenue, Net Income and Gross Margin of Dongfeng Motor Corporation, 2015-2021E
Bus Output and Sales Volume of SAIC MAXUS Automotive, 2012-2017
Capacity (including New Energy Vehicle) of SAIC MAXUS Automotive, 2016
Projects under Construction of SAIC MAXUS Automotive, 2016
Output, Sales Volume and Revenue of New Energy Vehicle of SAIC MAXUS Automotive, 2015-2016
Output and Sales Volume of Heavy Truck of FAW Jiefang Automotive, 2010-2017
Output and Sales Volume of Medium Truck of FAW Jiefang Automotive, 2010-2017
Output and Sales Volume of Light Truck of FAW Jiefang Automotive, 2010-2017
Output and Sales Volume of Mini Truck of FAW Jiefang Automotive, 2010-2017
List of Main Natural Gas Trucks of FAW Jiefang Automotive
Main Truck Manufacturing Bases of FAW Group
Revenue and Net Income of SINOTRUK, 2010-2016
Gross Margin of SINOTRUK, 2010-2016
Revenue Structure of SINOTRUK by Business, 2016
Output and Sales Volume of Heavy Truck of SINOTRUK, 2010-2017
Output and Sales Volume of Medium Truck of SINOTRUK, 2010-2017
Output and Sales Volume of Light Truck of SINOTRUK, 2010-2017
Heavy Truck Family Tree of SINOTRUK
Configuration of Main Products of SINOTRUK
Main Heavy Truck Products of Shaanxi Automobile Group
Output and Sales Volume of Heavy Truck of Shaanxi Automobile Group, 2010-2017
Output and Sales Volume of Medium Truck of Shaanxi Automobile Group, 2010-2017
Output and Sales Volume of Light Truck of Shaanxi Automobile Group, 2010-2017
Assets and Net Income of Hualing Xingma Automobile Group, 2012-2016
Product Lines of Hualing Xingma Automobile Group
Truck Output and Sales Volume of Anhui Hualing Automobile, 2015-2016
Truck Output and Sales Volume of Anhui Hualing Automobile by Region, 2015-2016
Revenue and Net Income of QingLing Motors Group, 2010-2016
Gross Margin of QingLing Motors Group, 2010-2016
Revenue of QingLing Motors Group by Product, 2015-2016
Output and Sales Volume of Heavy Truck of QingLing Motors Group, 2010-2017
Output and Sales Volume of Medium Truck of QingLing Motors Group, 2010-2017
Output and Sales Volume of Light Truck of QingLing Motors Group, 2010-2017
Brief History of SAIC GM Wuling
Main Truck (Mini Truck) Products of SAIC GM Wuling
Output and Sales Volume of Mini Truck of SAIC GM Wuling, 2010-2017
Distribution of Manufacturing Bases of SAIC GM Wuling
Output and Sales Volume of Heavy Truck of SAIC-IVECO Hongyan, 2010-2017
Sales Target of SAIC-IVECO Hongyan in 2017
Main Heavy Truck Products of Hubei Tri-Ring Special Vehicle
Output and Sales Volume of Heavy Truck of Hubei Tri-Ring Special Vehicle, 2010-2017
Output and Sales Volume of Medium Truck of Hubei Tri-Ring Special Vehicle, 2010-2017
Output and Sales Volume of Light Truck of Hubei Tri-Ring Special Vehicle, 2010-2017
Output and Sales Volume of Heavy Truck of XCMG Automobile, 2010-2017
Distribution of Main Truck Capacity of XCMG Automobile, 2016
Assets, Liabilities and Revenue of GAC HINO Motors, 2012-2016
Output and Sales Volume of Heavy Truck of GAC HINO Motors, 2010-2017
Capacity of GAC HINO Motors, 2016
Output and Sales Volume of Heavy Truck of Zhejiang Feidie Automobile Manufacturing, 2010-2017
Output and Sales Volume of Medium Truck of Zhejiang Feidie Automobile Manufacturing, 2010-2017
Output and Sales Volume of Light Truck of Zhejiang Feidie Automobile Manufacturing, 2010-2017
Truck Output and Sales Volume of Baotou Bei Ben Heavy-Duty Truck, 2010-2017
Output and Sales Volume of Heavy Truck of Shanxi Dayun Automobile Manufacturing, 2010-2017
Output and Sales Volume of Medium Truck of Shanxi Dayun Automobile Manufacturing, 2010-2017
Output and Sales Volume of Light Truck of Shanxi Dayun Automobile Manufacturing, 2010-2017
Global and China Leading Tier1 Suppliers’ Intelligent Cockpit Business Research Report, 2022 (II)
Tier1 Intelligent Cockpit Research: The mass production of innovative cockpits gathers pace, and penetration of new technologies is on a rapid riseGlobal OEMs and Tier 1 suppliers are racing for the i...
Global and China Leading Tier1 Suppliers’ Intelligent Cockpit Business Research Report, 2022 (I)
Tier1 Intelligent Cockpit Research: The mass production of innovative cockpits gathers pace, and penetration of new technologies is on a rapid riseGlobal OEMs and Tier 1 suppliers are racing for the i...
China Commercial Vehicle Intelligent Cockpit Industry Report 2021
Research on Intelligent Cockpits of Commercial Vehicles: Heading for Large Screens, Voice Interaction, Entertainment and Life
Following AD/ADAS functions, the intelligent configuration of the cockpit...
Automotive Ultra Wide Band (UWB) Industry Report, 2022
UWB got initially utilized in the military field, and began to be commercially applied after the release of criteria for UWB commercialization in 2002. In 2019, Car Connectivity Consortium (CCC) liste...
China Automotive Distribution and Aftermarket Industry Report, 2022-2027
Since the introduction of 4S store model into China at the end of 20th century, China's authorized dealer system has gradually developed from a single-store-based mode to a group-based mode, and from ...
Global and China Skateboard Chassis Industry Report, 2021-2022
Research into skateboard chassis: where to sell, how to sell and to whom it is sold
Rivian, a new carmaker based on skateboard chassis, is quite popular in the market and becomes the focus of the aut...
Emerging Automakers Strategy Research Report, 2022--NIO
Research on emerging carmaking strategies: no new cars in 2021, 3 new cars in 2022, can NIO make its renaissance?
The delivery of ET7 is imminent, and the sluggish sales situation is expected to fade...
Automotive and 5G Industry Integration Development Report, 2022
Research on integration of vehicle and 5G: OEMs rush into mass production of 5G models whose sales may reach 3.68 million units in 2025
By the end of 2021, China had built and opened in excess of 1.3...
China Automotive Finance Industry Report, 2022-2030
Auto finance is lucrative with the highest profit margin in the international automobile industry chain, contributing to roughly 23% of the global automobile industry profits. Yet, auto finance only h...
Global and China Power Battery Management System (BMS) Industry Report, 2022-2026
1. Robust demand from new energy vehicle spurs BMS market to boom
New energy vehicle sales have been growing rapidly worldwide over the recent years, reaching 6.5 million units with a year-on-year up...
ADAS/AD Chip Industry Research Report, 2022
Autonomous driving chip research: In addition to computing power, core IP, software stacks, AI training platforms, etc. are becoming more and more importantL2.5 and L2.9 have achieved mass production ...
Automotive Sensor Chip Industry Research Report, 2022
Sensor Chip Research: Automotive Sensors Have Entered a Technology Iteration Cycle, and Opportunities for Localization of Chips Are Coming Automotive sensor chips can obtain external environment ...
Automotive Cloud Service Platform Industry Report, 2021-2022
Research on Automotive Cloud Services: Based on 5ABCD, cloud services run through the R&D, production, sale, management and services of automakersWith the development of intelligent connectivity, ...
Global and China Cobalt Industry Report, 2021-2026
As a very rare metal and an important strategic resource for a country, cobalt gets typically utilized in battery materials, super heat-resistant alloys, tool steels, cemented carbides, and magnetic m...
Automotive Event Data Recorder (EDR) Industry Report, 2022
An event data recorder (EDR), sometimes referred to informally as an automotive black box, is a device or a system installed in vehicle to monitor, collect and record technical vehicle data and occupa...
Commercial Vehicle ADAS Industry Report, 2021
ResearchInChina has published the "Commercial Vehicle ADAS Industry Report, 2021", focusing on policy climate, ADAS installations, suppliers, etc., and with a deep dive into the prospects of Chinese c...
Automotive High-precision Positioning Research Report, 2022
High-precision Positioning Research: from L2+ to L3, high-precision integrated navigation and positioning will become the standard
With the development and progress of the autonomous driving industry...
China Around View System (AVS) Suppliers and Technology Trends Report, 2021 –Joint Venture Automakers
Research into JV automakers’ around view system: large-scale implementation of AVP is round the corner, and AVS vendors are energetically pushing ahead with parking fusion solution.
During January to...